Financial Plans and Performance
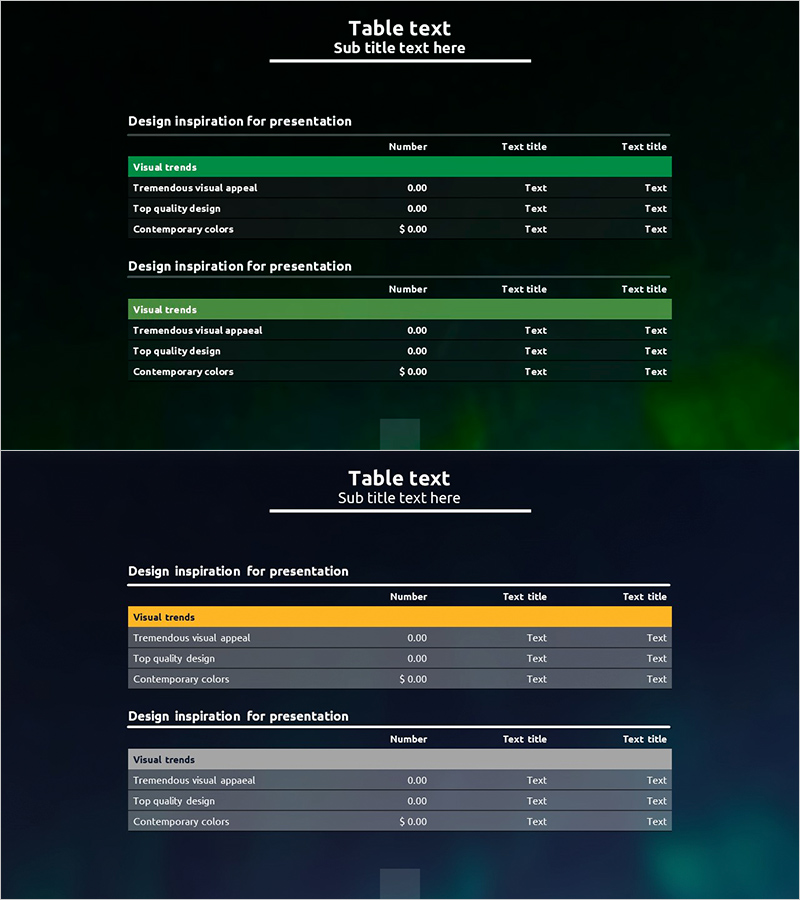
Aurora Camping Business Key Financial Indicator Table
RJ0600032_24
- Last Update 12/21/2025
- File Size 1.1MB
- # of Slides 2
- File Format PPTX
- Slide Ratio 16:9
- Color
Keywords
About the Product
This table slide clearly visualizes the key financial indicators for the Aurora Camping business. Utilizing vibrant blue, green, and yellow colors to represent each data item, it provides a lively presentation while offering a clear structure for classification and easy analysis. The visual comparison allows for effective budget planning and financial performance analysis. This slide can be effectively used in professional financial reports or business plans.
Related Products
-
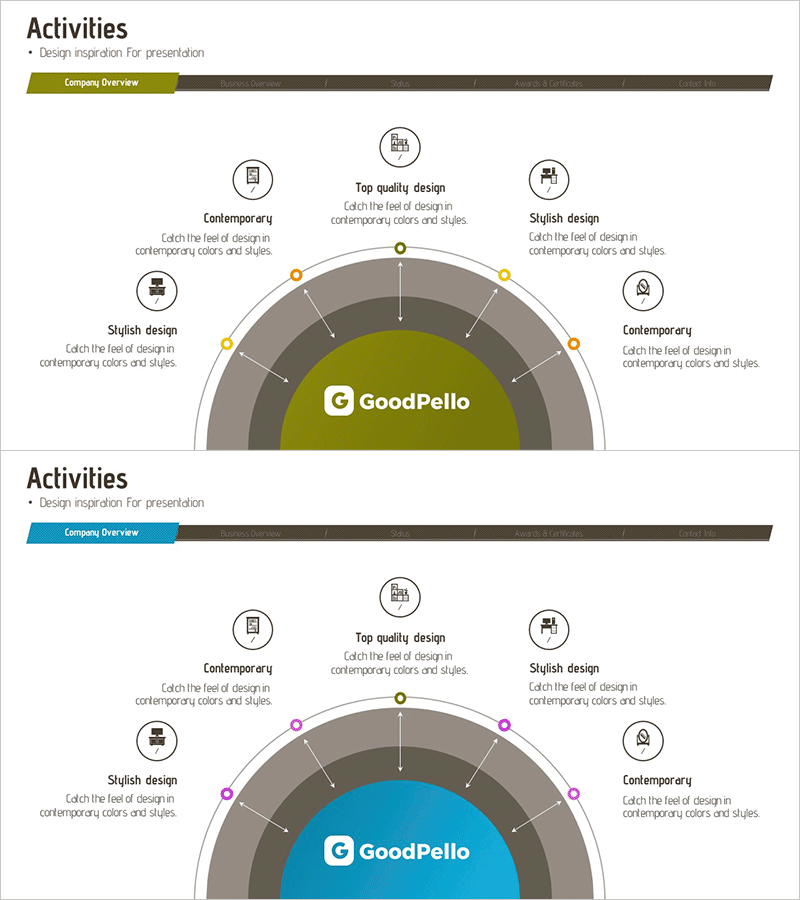
Business Activity Areas Diagram – Strategic Cluster Composition
#Business Introduction #Business Vision and Strategy #Diagram
-

Triangle Area Diagrams – Business Introduction and Revenue Model
#Business Introduction #Diagram #Business Areas
-
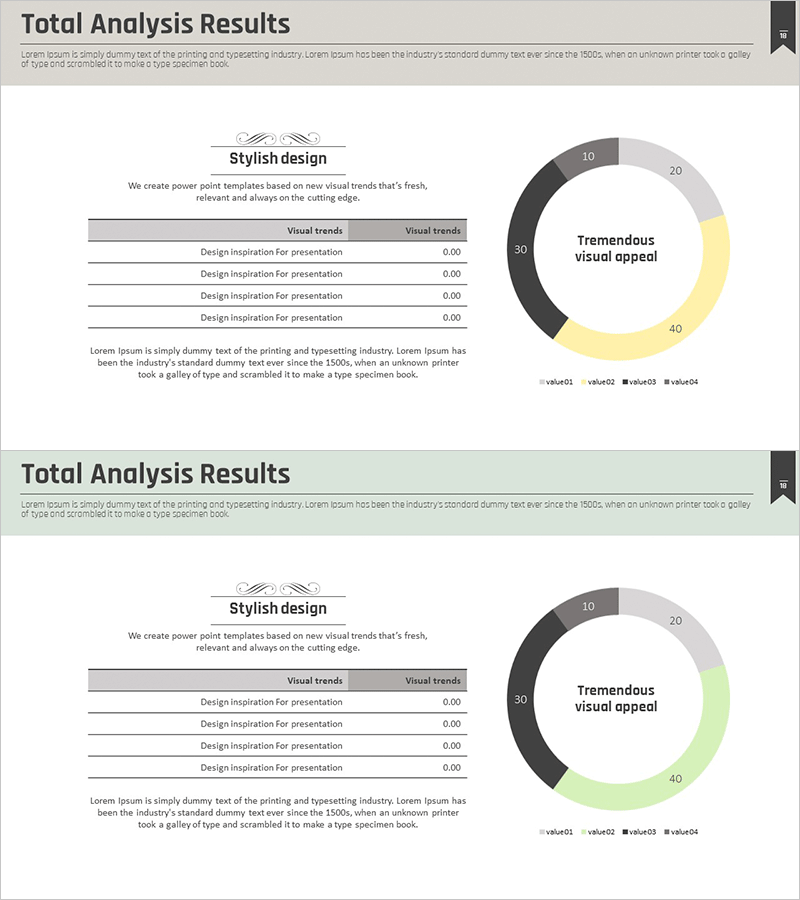
Big Data Comprehensive Analysis Chart – Insights for Market Analysis
#Business Introduction #Market and Competitor Analysis #Diagram
-
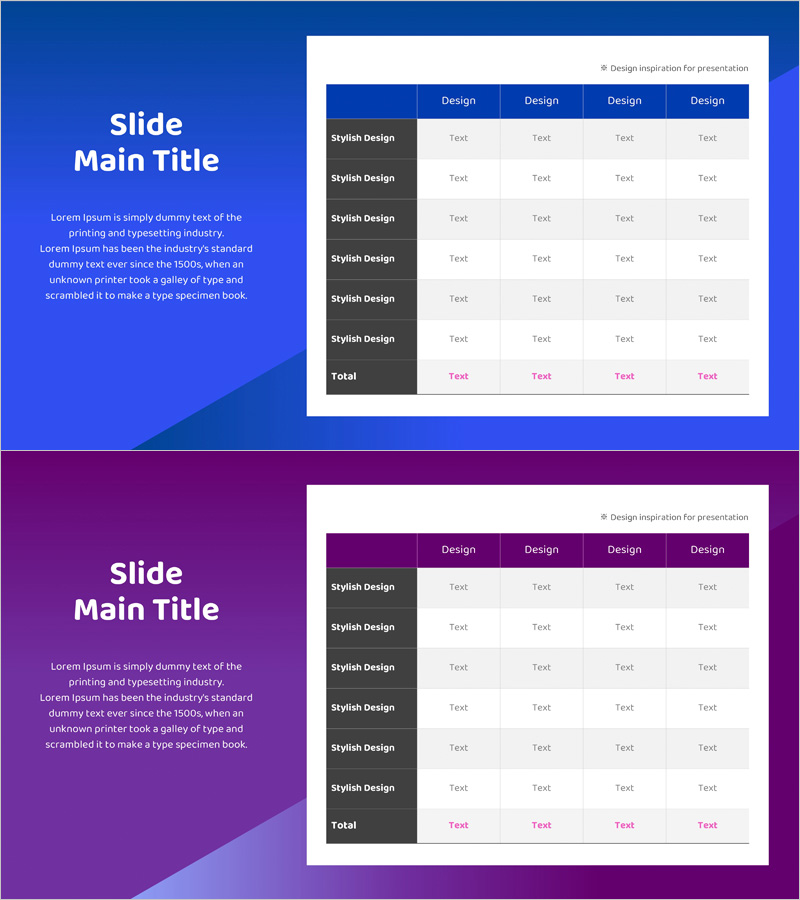
Financial Performance Analysis Table Slide – Data Visualization for Growth
#Financial Plans and Performance #Diagram #Income Statement
