Market and Competitor Analysis
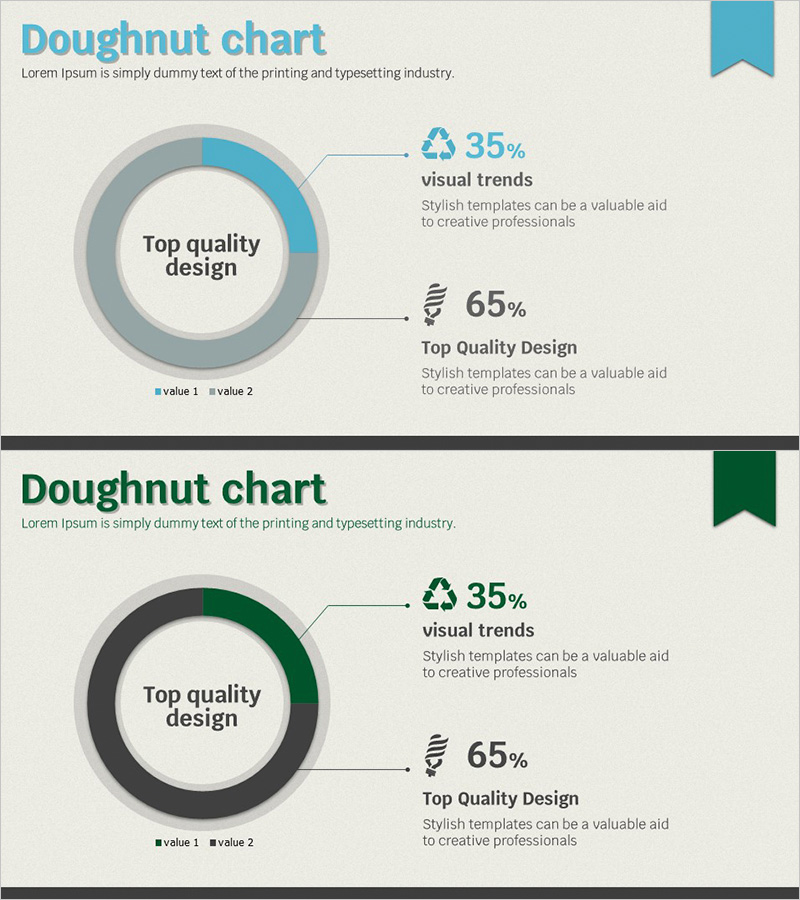
Separate Recycling Implementation Rate Survey Donut Chart – Visualized in Blue and Green
RJ0600022_9
- Last Update 12/21/2025
- File Size 2.1MB
- # of Slides 2
- File Format PPTX
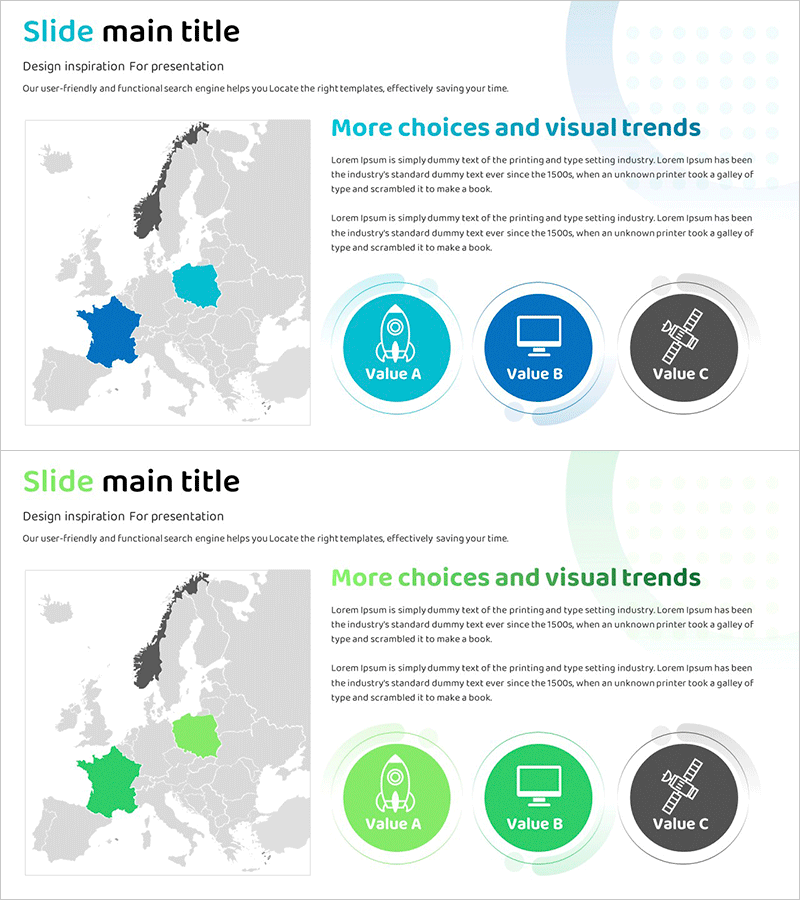
- Slide Ratio 16:9
- Color
Keywords
About the Product
This slide presents a donut chart that effectively visualizes the implementation rate of recycling separation. The harmonious color combination of blue and green emphasizes an eco-friendly image while clearly conveying data distribution. Ideal for analyzing customer recycling behavior and understanding market trends, this chart can be utilized in market and customer analysis reports to present data intuitively. The slide is structured for easy editing, allowing users to quickly adapt values for integration into PowerPoint presentations. The editing difficulty level is moderate, making it suitable for various presentation scenarios.
Related Products
-
Visualizing Plant Growing Market Size – Achievements and Competitive Edge
#Business Promotion Strategy #Market and Competitor Analysis #Graph
-
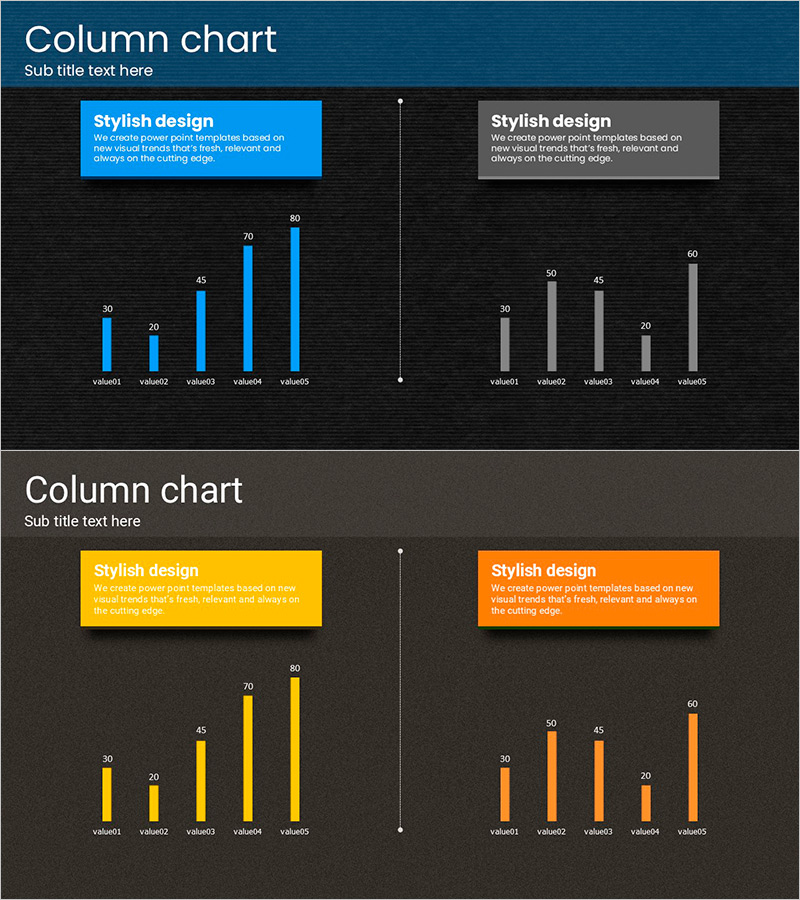
Touch Wide Slide Template for Market Analysis with Vertical Column Chart
#Business Promotion Strategy #Market and Competitor Analysis #Graph
-
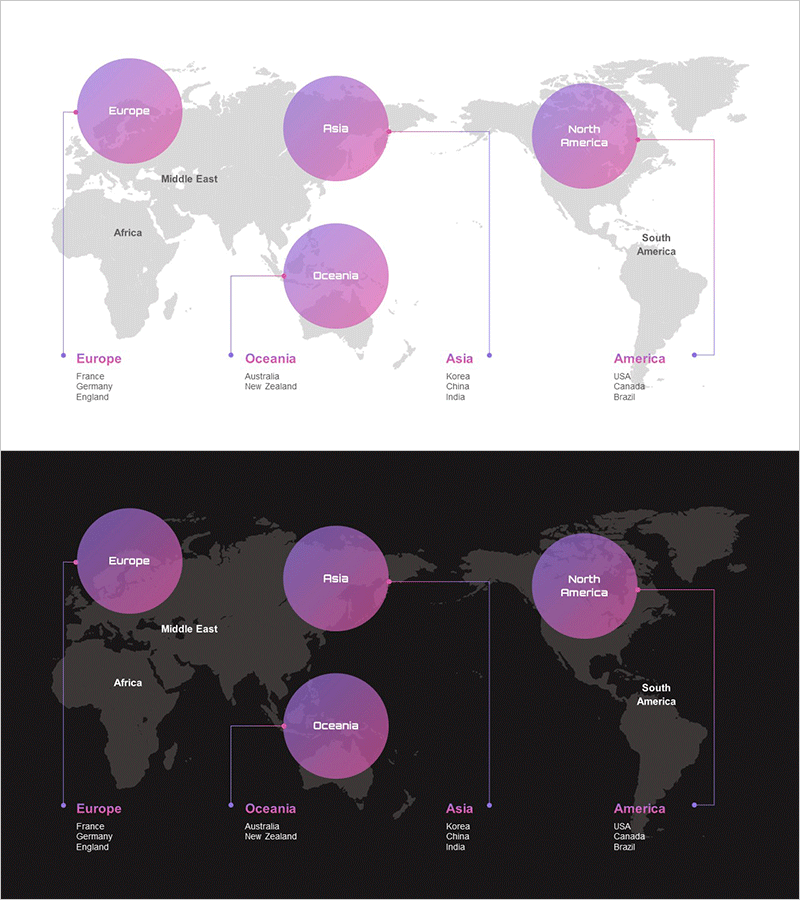
PowerPoint Template Visualizing Global Target Market
#Company Introduction #Market and Competitor Analysis #Other
-
Progress of the European Space Industry by Region Diagram
#Market and Competitor Analysis #Marketing Plan and Strategy #Diagram
