PowerPoint Template Visualizing Global Target Market
RJ0700027_19
- Last Update 07/29/2025
- File Size 0.7MB
- # of Slides 2
- File Format PPTX
- Slide Ratio 16:9
- Color
Keywords
- #Content-Based Slides
- #Design-Based Slides
- #Company Introduction
- #Market and Competitor Analysis
- #Other
- #Global Network
- #Target Market
- #Map
- #16:9
- #global map PowerPoint slide
- #world map presentation template
- #regional market analysis slide
- #international network map PPT
- #how to visualize global target markets
About the Product
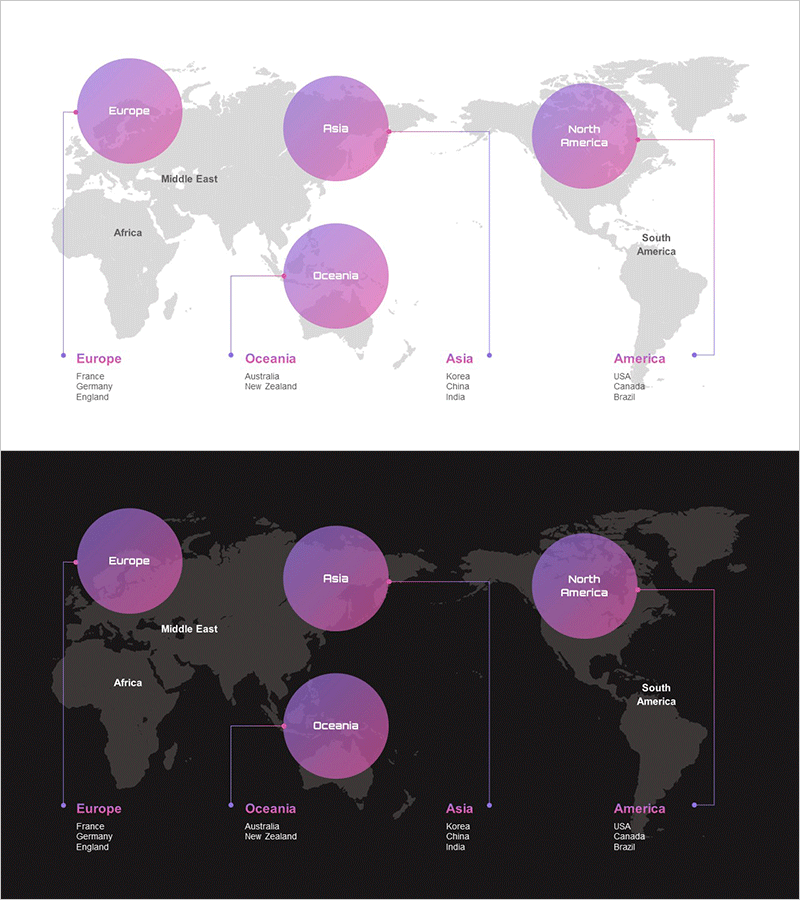
A PowerPoint slide visualizing six global regions (Europe, Asia, Oceania, North America, South America, and Middle East) using purple bubble circles on a world map background. Two versions are provided: light background and dark background, each displaying key countries per region (France, Germany, UK, Korea, China, India, Australia, New Zealand, USA, Canada, Brazil) in list format. This slide effectively communicates global business presence, market expansion strategies, and international partnership structures at a glance. Ample text input areas allow you to add regional sales figures, market share, and strategic information. Choose the background color that suits your presentation environment.
Usage Points
-
Main Usage
Visualize global business presence and regional hubs to effectively communicate international market expansion strategies, global partnership structures, and regional sales performance. Ideal for investor presentations, executive reports, and international business negotiations to clearly represent regional business portfolios.
-
How to Use
Insert sales figures, market share percentages, or growth rates within each regional bubble, or add key country names to the bottom list. Use the light background for daytime presentations and printed materials; use the dark background for evening presentations and large-screen displays. Customize regional bubble colors to distinguish performance tiers or strategic phases.
-
Recommended For
Global company executives, investor relations teams, marketing strategy departments, and international sales teams presenting quarterly results, new market entry plans, and global partnership negotiations. Highly effective for consulting firms, financial institutions, and multinational corporations in strategic presentations.
-
Slide Structure
World map background with 6 regional purple bubbles (Europe, Asia, Oceania, North America, South America, Middle East/Africa), bottom section lists 5-6 key countries per region. Total 12 text input areas (6 region names + 6 country lists), three-tier information hierarchy: region > country > detailed data.
Related Products
-

Global Network Target Region Analysis – Stylish Design Visualization
#Company Introduction #Market and Competitor Analysis #Other
-

Global Target Country Analysis – Strategic Market Insights
#Company Introduction #Market and Competitor Analysis #Diagram
-

Global Network Map – Market Analysis and Opportunity Exploration
#Company Introduction #Market and Competitor Analysis #Other
-

Target Market Goal Map for Global Market Analysis
#Company Introduction #Market and Competitor Analysis #Other
