Market and Competitor Analysis
World Map and Share Chart for Market Analysis – Effective Data Visualization
RJ0600007_17
- Last Update 12/21/2025
- File Size 2.3MB
- # of Slides 2
- File Format PPTX
- Slide Ratio 16:9
- Color
Keywords
About the Product
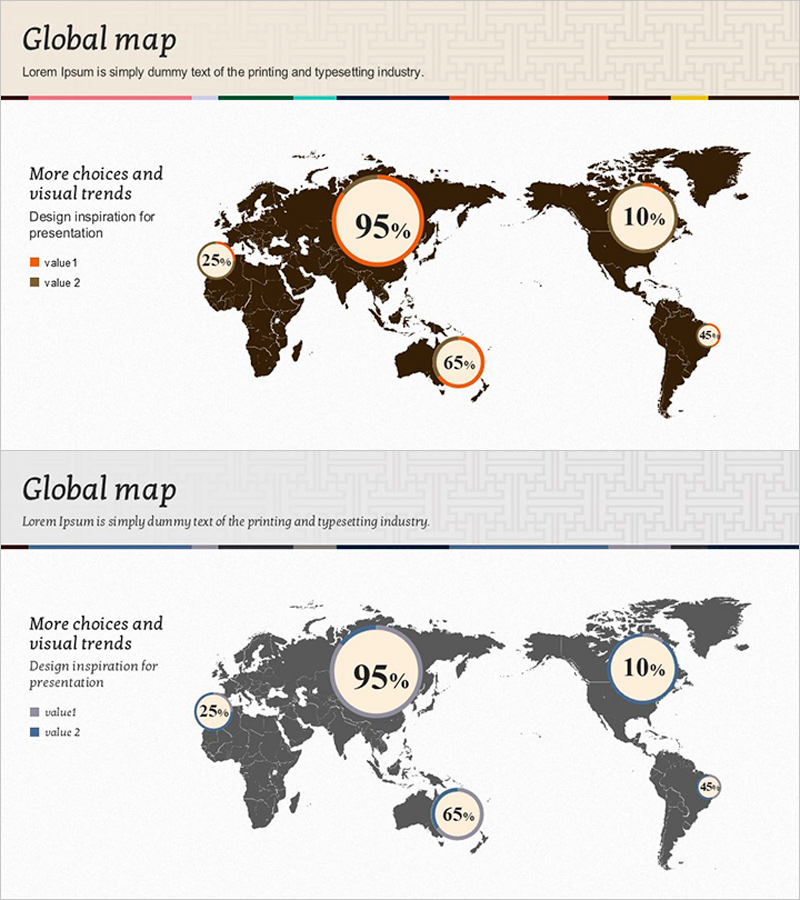
This slide utilizes a world map as a base for a donut chart, visually conveying market shares across various regions. The chart effectively illustrates the overall market status, making it highly useful for market analysis and competitor comparison. With a stable combination of brown and gray hues, it imparts a professional feel, featuring a clear distinction between the title area at the top and the data chart at the bottom. It is suitable for corporate business strategic meetings, speeches, or reports. Data and text replacement within the slide is easy, and the editing difficulty is average, allowing for quick application in various presentations.
Related Products
-
SNS Usage Status Comparison Graph – Market Analysis and Competitive Advantage
#Market and Competitor Analysis #Graph #Competitor Analysis
-
Analysis graph of market share progress
#Product/Service #Market and Competitor Analysis #Graph
-

Introduction to Social Network Programs – Business Goals and Vision
#Product/Service #Business Vision and Strategy #Diagram
-

User Interviews & Personas Slide – Essential Tool for Customer Analysis
#Market and Competitor Analysis #Customer Success Stories #Diagram
