Business Promotion Strategy
Learning Goal Deflection Line Graph – Business Strategy
RJ0500043_27
- Last Update 12/21/2025
- File Size 0.4MB
- # of Slides 2
- File Format PPTX
- Slide Ratio 16:9
- Color
Keywords
About the Product
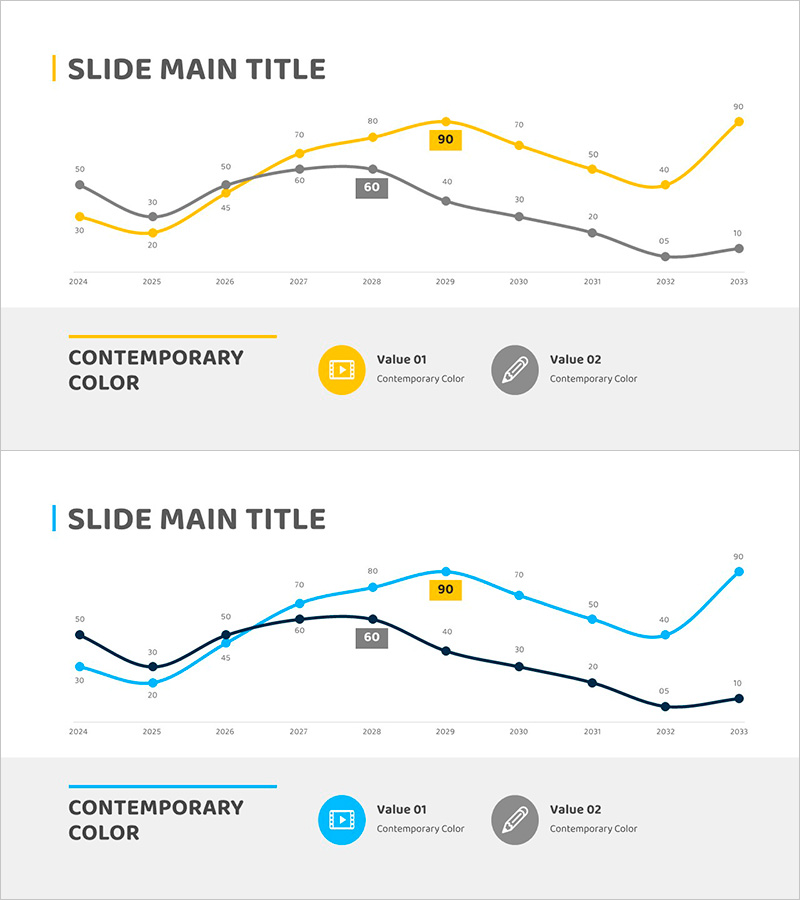
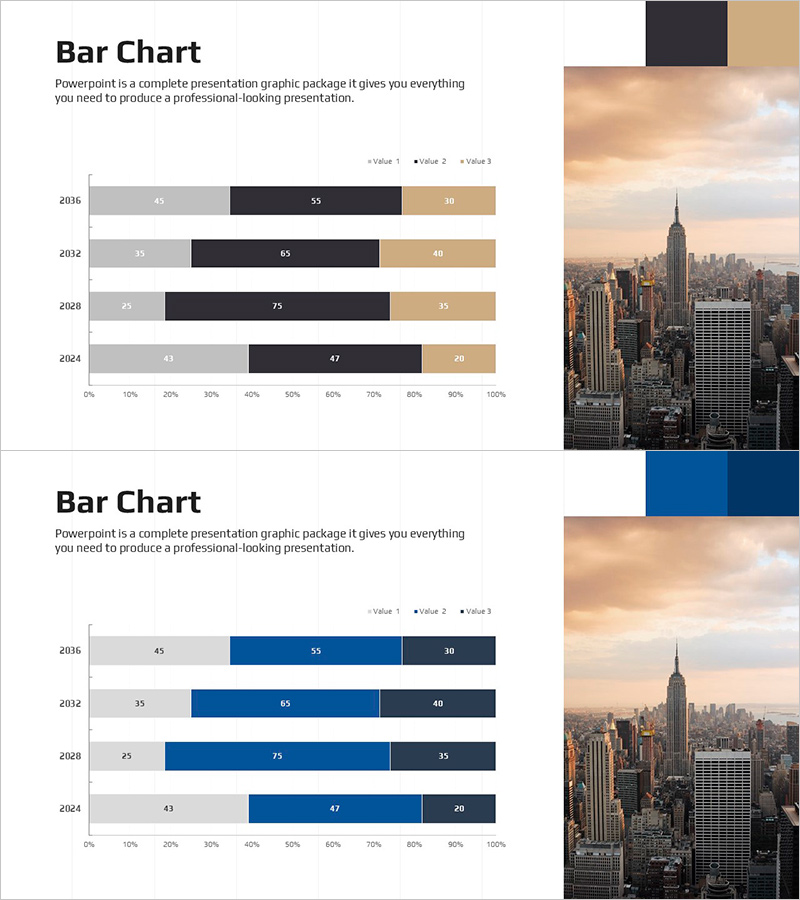
This slide utilizes a dual-color scheme (yellow and blue) for a line graph that visually represents learning goals. It intuitively illustrates performance changes based on data from 2024 to 2033. Its clean and distinct layout is suited for presentation materials, reports, or proposals, especially effective in presenting a clear direction for business strategies. Users can benefit from visual support for data analysis, performance tracking, and strategic decision-making. The graph and text areas are easily interchangeable, with a low editing difficulty level, making it flexible for various presentation contexts.
Related Products
-
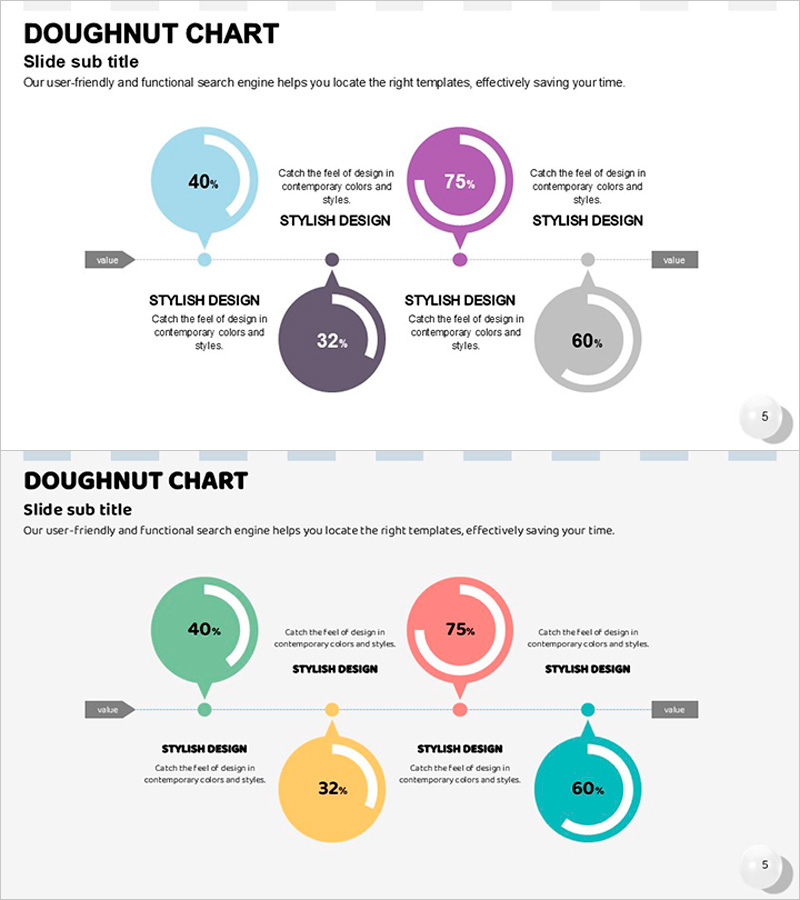
Balloon Donut Chart for Key Achievements Visualization – Successful Data Presentation
#Company Introduction #Product/Service #Graph
-
Wellness Value Positioning Slide – Market Analysis and Marketing Strategy
#Market and Competitor Analysis #Marketing Plan and Strategy #Diagram
-
Growth Vertical Bar Graph – Performance and Expectations
#Business Promotion Strategy #Graph #Revenue Outlook and Expected Effects
-
100% Cumulative Horizontal Bar Graph – Market Analysis
#Market and Competitor Analysis #Graph #Industry Trends
