
Market and Competitor Analysis
Line Chart of the Violence Survey – Market Analysis and Competitive Advantage
RJ0500040_15
- Last Update 12/21/2025
- File Size 0.5MB
- # of Slides 2
- File Format PPTX
- Slide Ratio 16:9
- Color
Keywords
About the Product
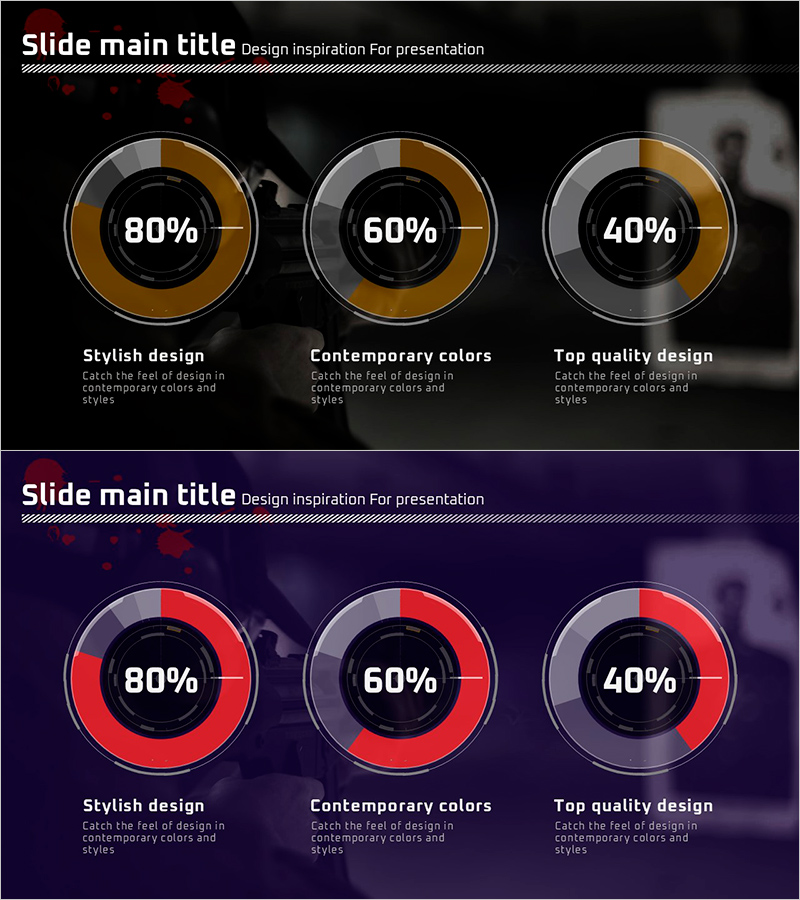
This slide effectively visualizes a line chart for the violence survey. Its design features a clear data comparison structure, allowing viewers to quickly grasp trends in violence incidents, using a vibrant color scheme that commands attention. The harmonious combination of red and purple provides a strong impact while ensuring each data point is distinctively represented. Ideal for market and competitive analysis, this slide summarizes necessary information for impactful presentations. With easy text and data replacement, the overall editing difficulty is rated as 'easy', enabling users to swiftly integrate it into various presentations.
Related Products
-
Market Analysis through Victim's Body Damage Level Chart – Infographic Use
#Market and Competitor Analysis #Graph #Market Status
-

Market Share Donut Graph – Stylish Data Visualization
#Market and Competitor Analysis #Financial Plans and Performance #Graph
-
Component Development Scale Pie Chart – Visualization of Competitive Advantage
#Product/Service #Market and Competitor Analysis #Graph
-
Construction Progress Chart – Business Introduction and Market Analysis
#Business Introduction #Market and Competitor Analysis #Graph
