Business Promotion Strategy
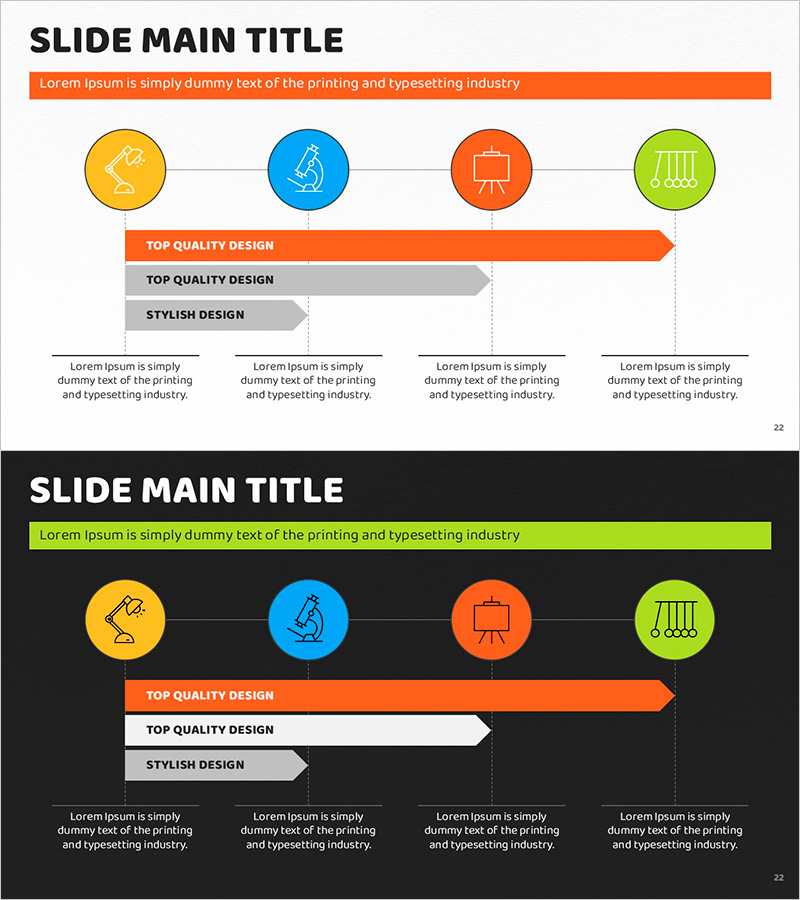
Linear Diagram Visualizing Arts and Science Progress
RJ0500031_21
- Last Update 12/21/2025
- File Size 1.7MB
- # of Slides 2
- File Format PPTX
- Slide Ratio 16:9
- Color
Keywords
About the Product
This slide utilizes a linear diagram to systematically visualize the progress of an arts and science project. The combination of orange and green colors provides a cohesive visual effect, clearly presenting the important aspects of each phase. This design is optimized for explaining progress in business strategy or project management, delivering clear information without specific emotional messaging. Editing is straightforward and involves basic text modifications, with a moderate difficulty level, making it suitable for various events or meetings.
Related Products
-
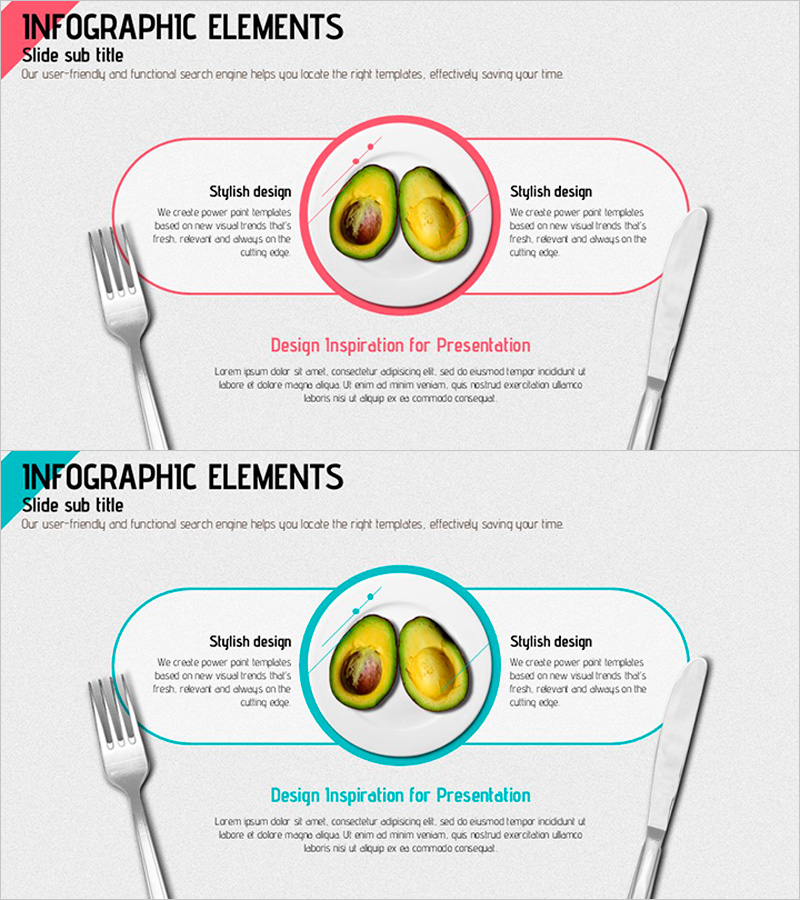
Avocado Diagram – Product/Service Differentiation Strategy
#Product/Service #Diagram #Differentiation Strategy for Products/Services
-
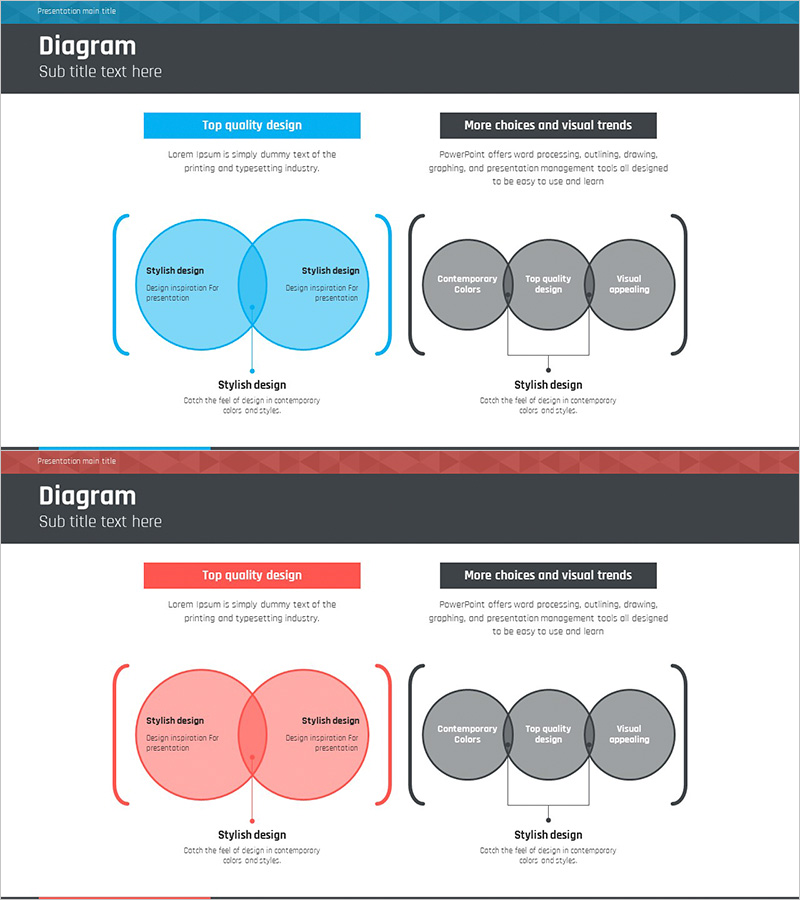
Sailing Travel Business Strategy Overlapping Diagram
#Product/Service #Business Vision and Strategy #Diagram
-
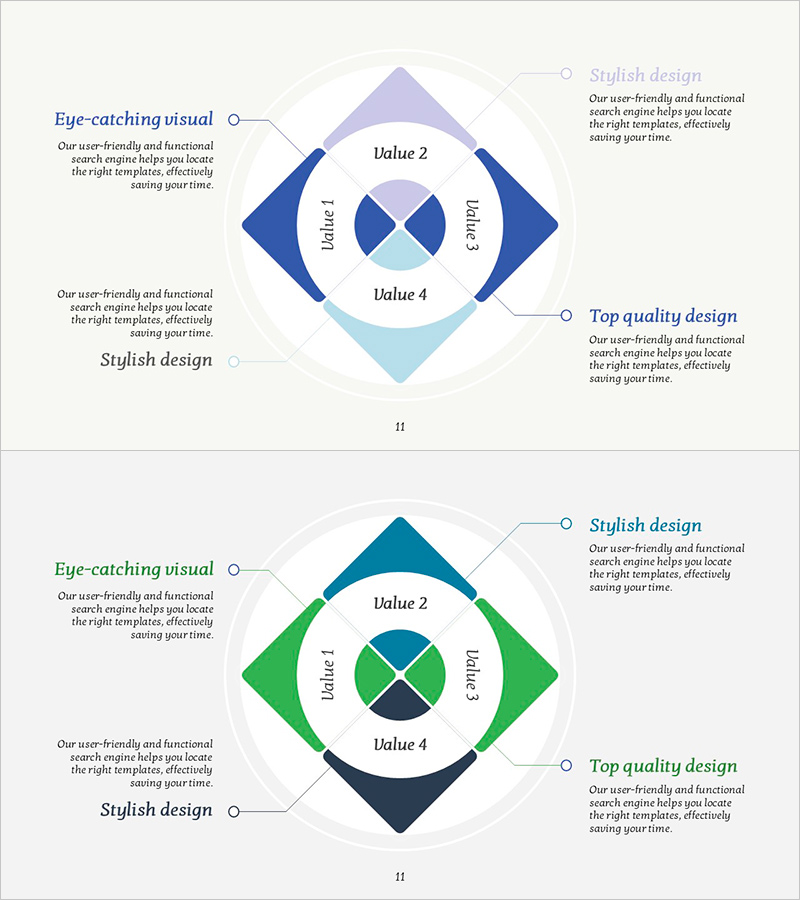
Connection Diffusion Composite Diagram for Service Operations
#Technology Sector #Diagram #Service Operation Approach
-
Create Financial Plans with a Simple Sky Table
#Financial Plans and Performance #Diagram #Balance Sheet
