Sailing Travel Business Strategy Overlapping Diagram
RJ0600072_28
- Last Update 07/09/2025
- File Size 0.2MB
- # of Slides 2
- File Format PPTX
- Slide Ratio 16:9
- Color
Keywords
- #Content-Based Slides
- #Design-Based Slides
- #Product/Service Introduction
- #Business Vision and Strategy
- #Diagram
- #Differentiation Strategy for Products/Services
- #Business Strategy
- #Cluster
- #Combination Diagram
- #16:9
- #overlapping diagram PowerPoint
- #Venn diagram slide template
- #business strategy diagram
- #circle overlap PPT
- #relationship diagram PowerPoint
About the Product
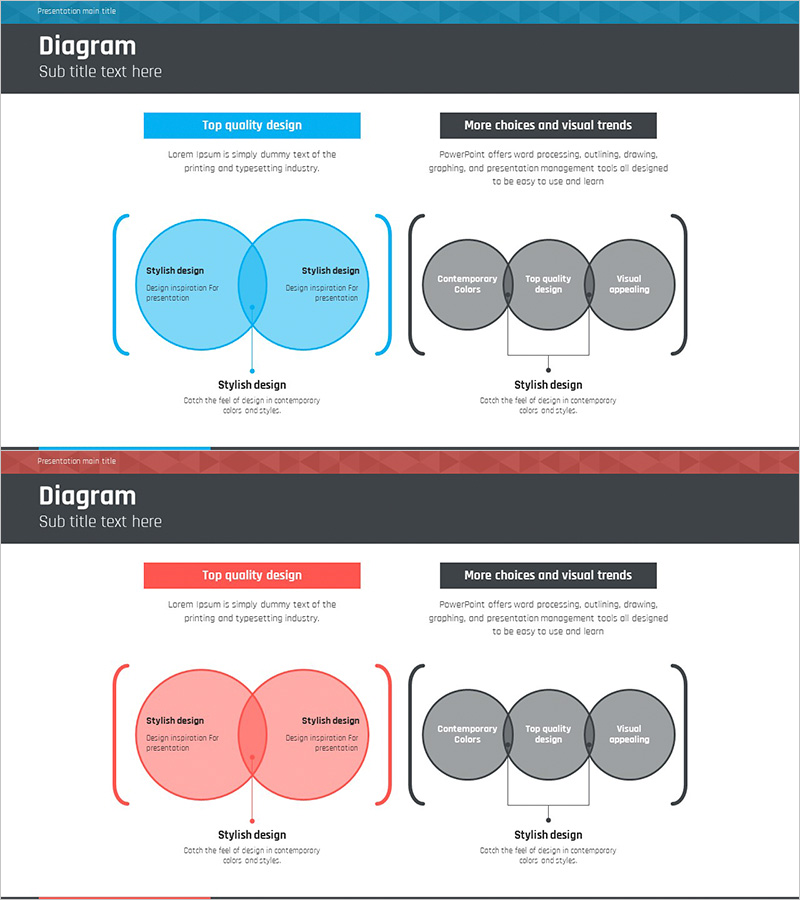
A business strategy and sailing travel-themed overlapping diagram PowerPoint slide featuring a Venn diagram design in two color schemes: blue and pink. Two overlapping circles emphasize the intersection area, with 'Stylish design' and 'Design inspiration' text positioned within each circle to visually represent relationships and commonalities between concepts. The accompanying three-circle cluster diagram connects 'Contemporary colors', 'Top quality design', and 'Visual appeal' elements to express multi-layered information structure. This 2-slide set is ready for immediate use in diverse business presentations, effectively supporting strategy development, comparative analysis, and process explanation.
Usage Points
-
Main Usage
Optimized to clearly express intersections and differences between two or more concepts, strategies, or departments. The Venn diagram format simultaneously highlights commonalities and unique characteristics, serving as decision-making material for business strategy development, market analysis, and organizational structure comparison.
-
How to Use
In the first slide's blue Venn diagram, input the first strategy in the left circle and the second strategy in the right circle, then enter common elements in the intersection area. The second slide's pink Venn diagram and 3-circle cluster are used for additional comparative analysis or multi-layered relationship mapping.
-
Recommended For
Executives, strategy teams, marketing departments, consultants, and educators use this for business strategy, competitive analysis, organizational restructuring, and process improvement presentations. Particularly suitable for reports, proposals, and training materials comparing two or more options or explaining mutual relationships.
-
Slide Structure
Slide 1: Blue header background + blue Venn diagram (2 overlapping circles) + gray 3-circle cluster diagram / Slide 2: Pink header background + pink Venn diagram (2 overlapping circles) + gray 3-circle cluster diagram. Each slide features a two-column layout with left and right diagrams supporting comparative analysis.
Related Products
-

Urban Science Overlay Diagram – Innovative Business Strategy
#Product/Service Introduction #Business Vision and Strategy #Diagram
-

Differentiated Fashion Strategy Slide – Business Vision and Strategy
#Product/Service Introduction #Business Vision and Strategy #Diagram
-

Water Resources Overlapping Diagram Presentation Template
#Product/Service Introduction #Business Vision and Strategy #Diagram
-

Overlap Diagram for Analysis and Strategy – Business Insights
#Product/Service Introduction #Business Vision and Strategy #Diagram
