Business Introduction
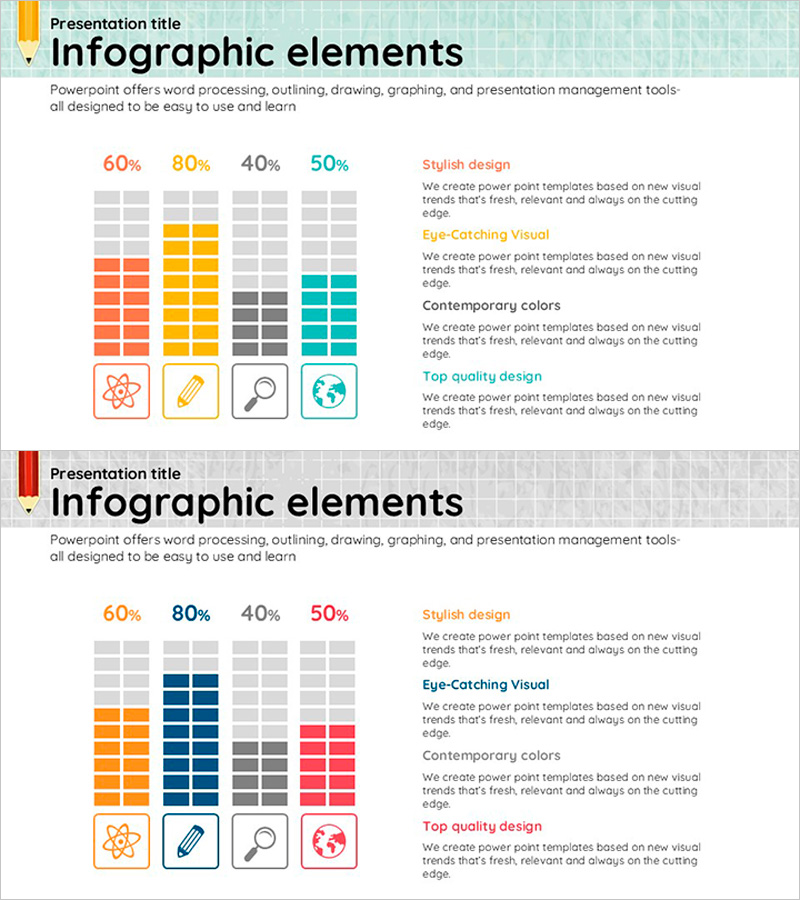
Gauge Charts by Area of Study – Highlighting Technological Innovations
RJ0500004_7
- Last Update 12/21/2025
- File Size 1.8MB
- # of Slides 2
- File Format PPTX
- Slide Ratio 16:9
- Color
Keywords
About the Product
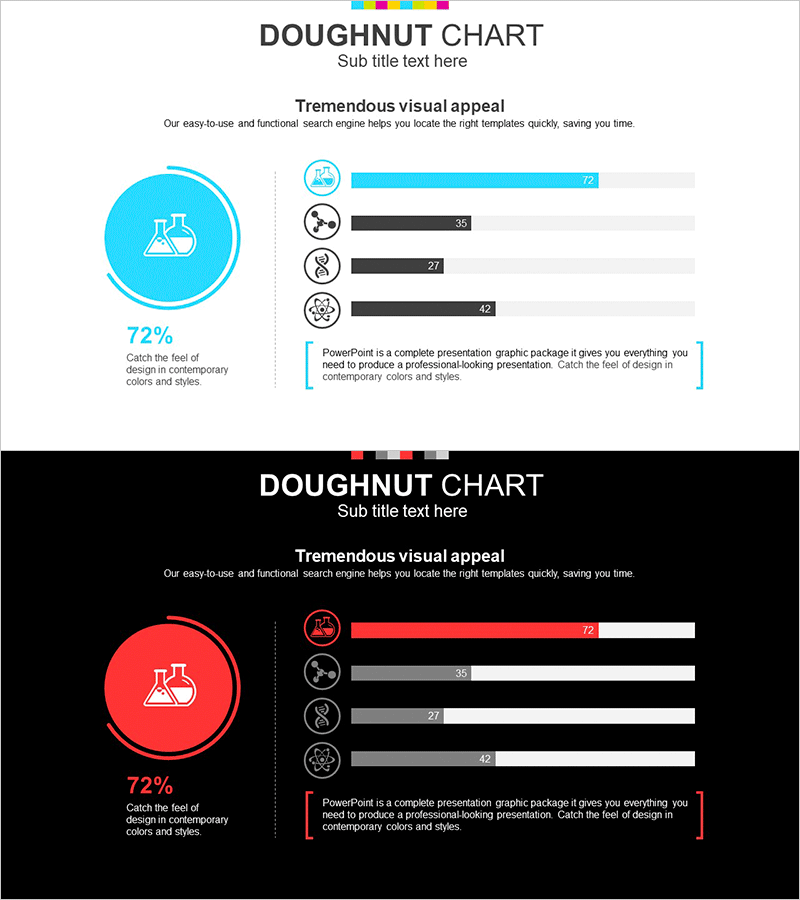
This slide features gauge charts that intuitively display the technological innovation status across various areas of study. With distinctive red, yellow, and teal colors, it presents an aesthetically pleasing design that allows for easy comparison of achievements and progress across fields. Ideal for presentations related to operational planning and technology status, this slide enhances audience comprehension and data readability. Text and chart areas are simple to modify, with an overall editing difficulty rated as 'easy' for quick integration.
Related Products
-
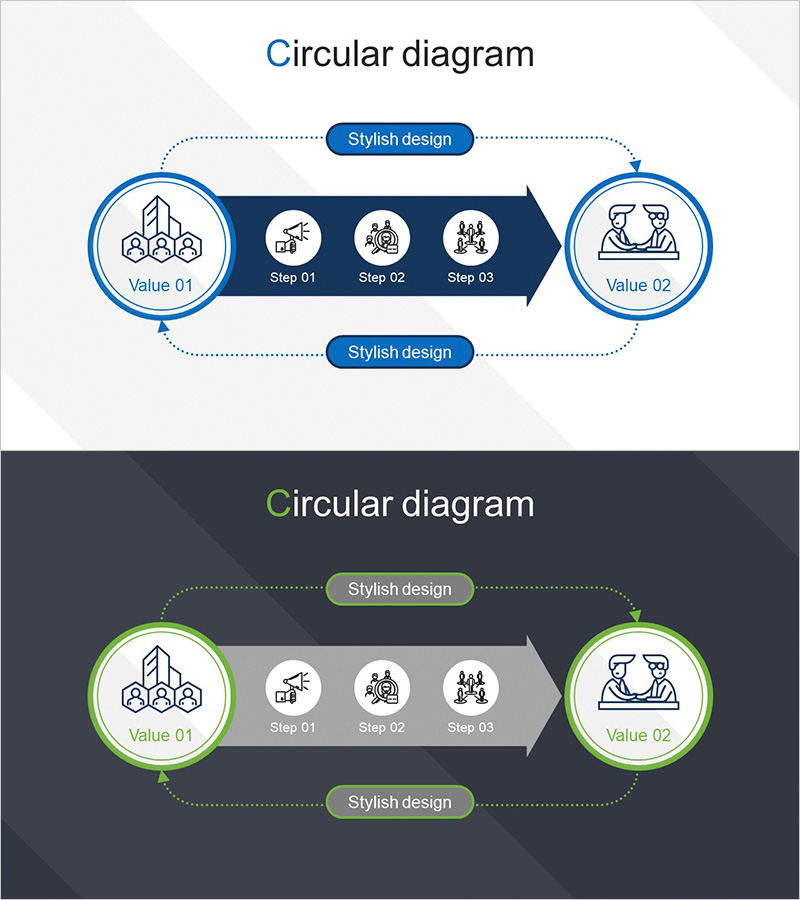
Partner Business Process – Visualizing the Circular Diagram
#Operation Plan #Technology Sector #Diagram
-
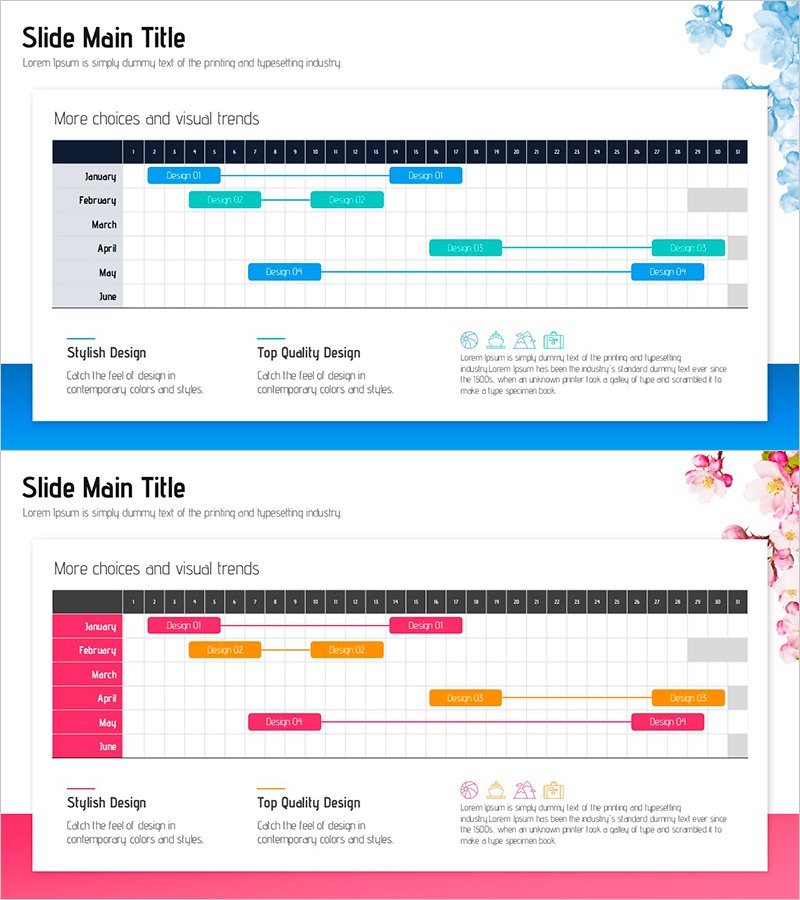
Schedule Management Diagram - Blue Pink Theme
#Business Management #Operation Plan #Diagram
-
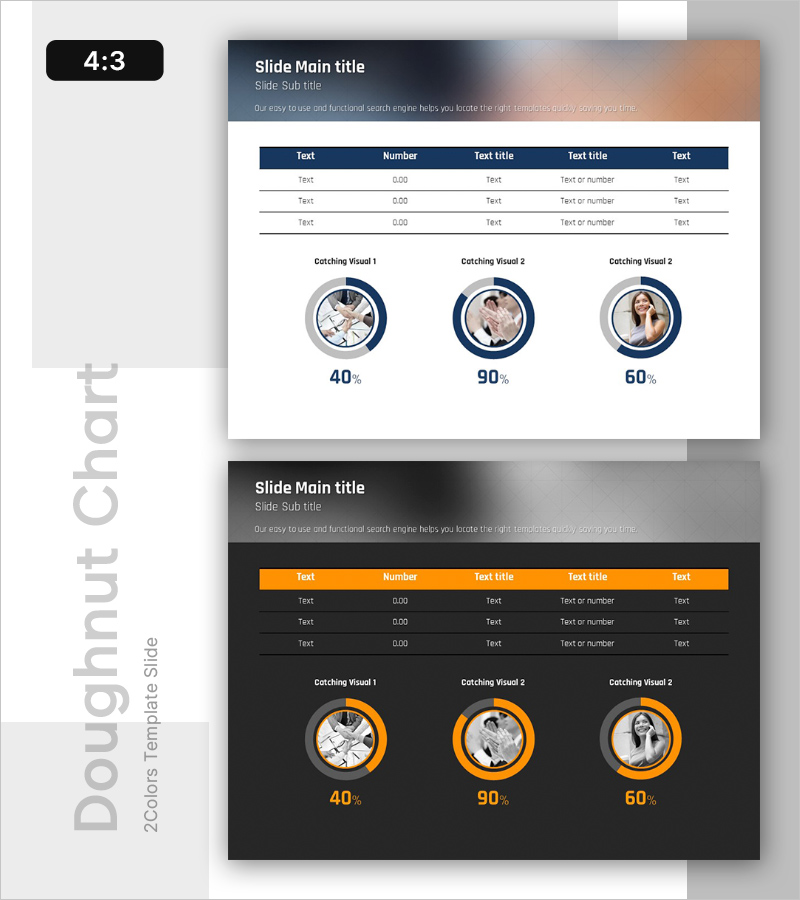
Business Status Chart – Presentation Template for Market Analysis
#Market and Competitor Analysis #Diagram #Graph
-
Chemistry Experiment Progress Graph – Visualizing Market Share
#Product/Service #Market and Competitor Analysis #Graph
