Business Vision and Strategy
Big Data Business Strategy Connection Diagram
RJ0400053_28
- Last Update 12/21/2025
- File Size 0.7MB
- # of Slides 2
- File Format PPTX
- Slide Ratio 16:9
- Color
Keywords
About the Product
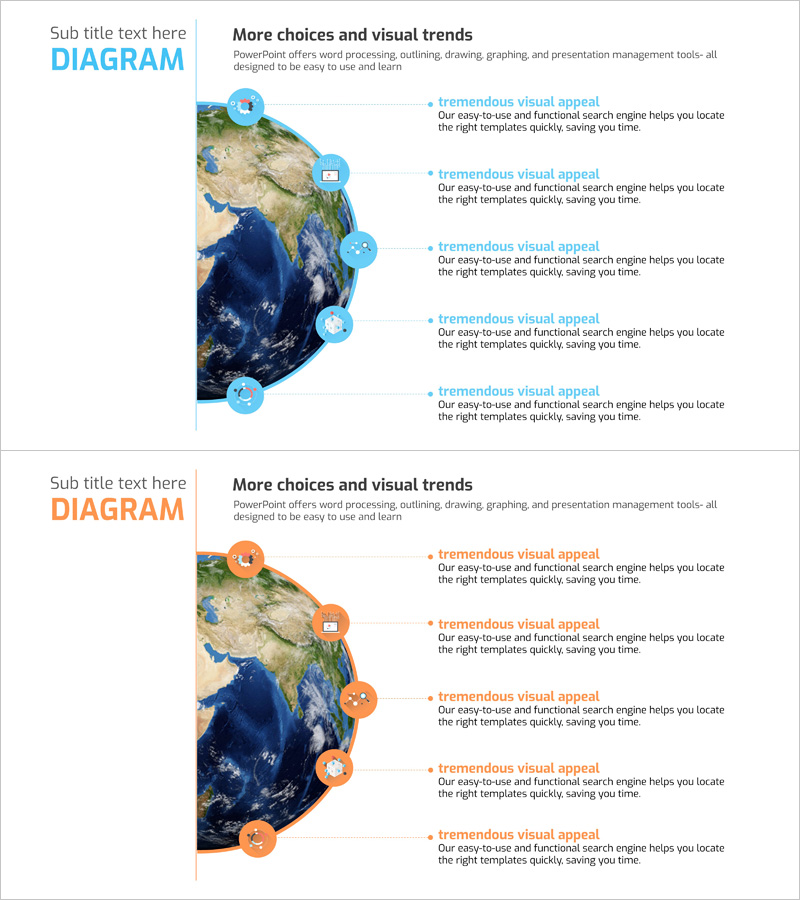
This slide presents a diagram that intuitively connects the big data business strategy. The cluster structure visually illustrates how various strategic elements interact with each other. The harmonious combination of blue and orange colors adds a distinctive touch, aiding in clearly conveying marketing plans and strategies. This slide can be effectively utilized in various business scenarios such as business planning documents, marketing strategy presentations, and business case analyses. The editing difficulty is rated as easy, allowing you to freely replace text and images.
Related Products
-
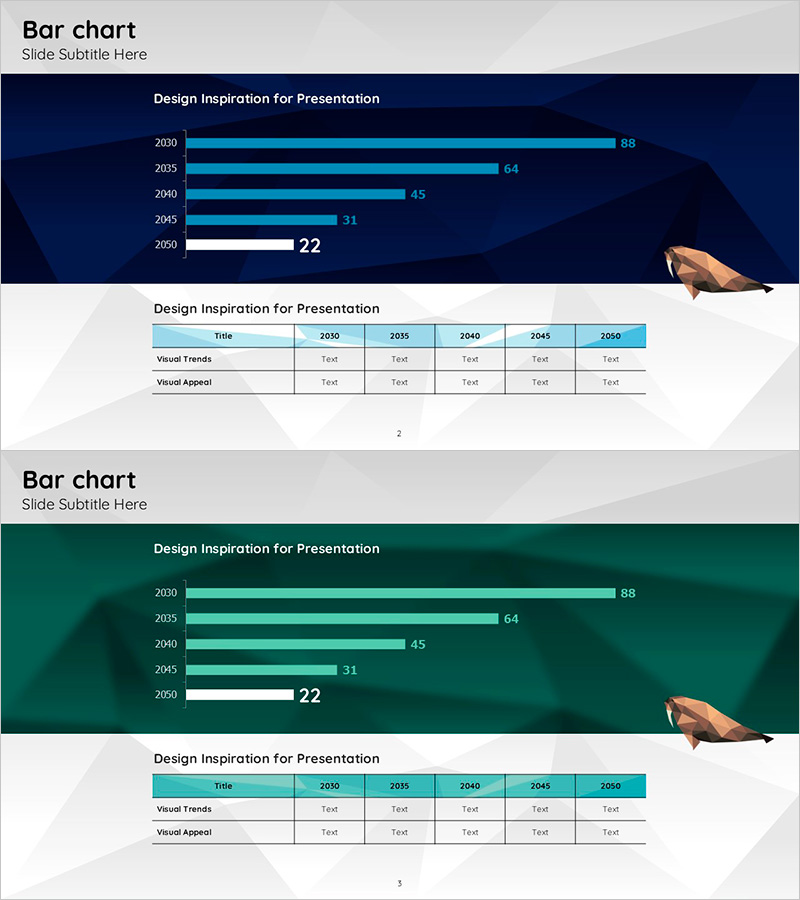
Arctic Market Future Outlook Bar Chart
#Business Promotion Strategy #Market and Competitor Analysis #Diagram
-
Construction Business Process Diagram – Visualize Effective Workflows
#Business Management #Operation Plan #Diagram
-
Sales Rate by Product Recently – Market Competition Analysis
#Market and Competitor Analysis #Financial Plans and Performance #Diagram
-
Analytical Stages and Key Features of Genetic Research
#Product/Service #Technology Sector #Diagram
