Construction Business Process Diagram – Visualize Effective Workflows
RJ0300034_18
- Last Update 04/27/2025
- File Size 5.6MB
- # of Slides 2
- File Format PPTX
- Slide Ratio 16:9
- Color
Keywords
- #Content-Based Slides
- #Design-Based Slides
- #Business Management
- #Operational Plan
- #Diagram
- #Execution Plan
- #Business Processes
- #Cluster
- #Chain Diagram
- #16:9
- #circular process diagram PowerPoint
- #process flow diagram slide
- #6-step workflow template
- #business process PPT
- #connected diagram slide template
About the Product
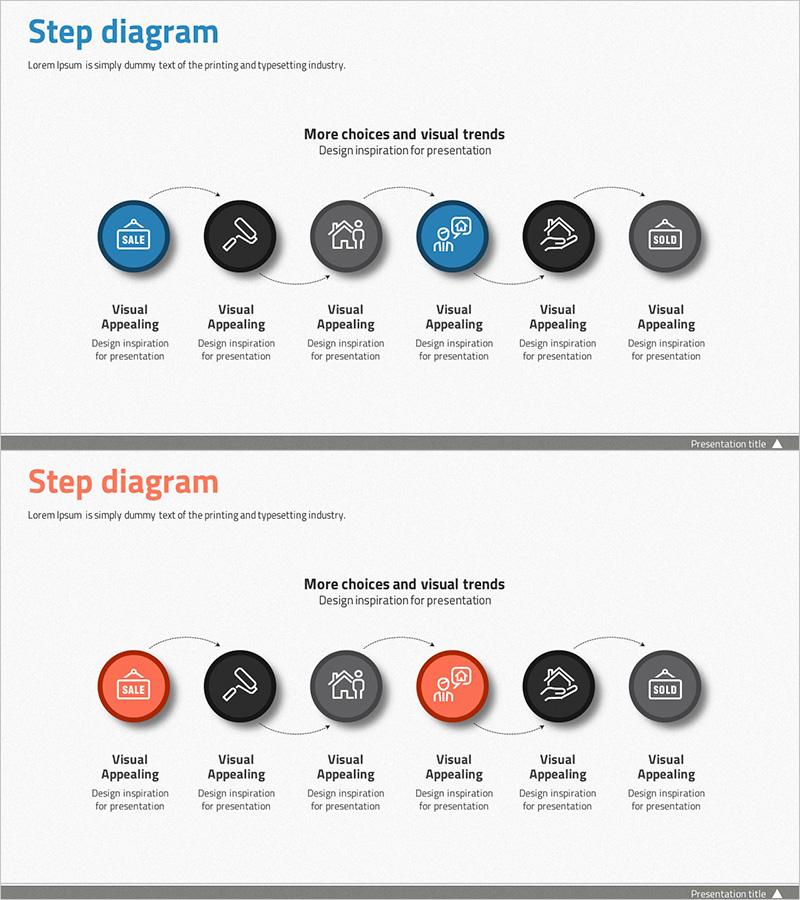
A 6-step circular process diagram PowerPoint slide designed to visualize construction business workflows and project management cycles. Six icon nodes (sale, tool, house, person, hand, sold) are arranged in a circle and connected by directional arrows, clearly representing repetitive processes and operational cycles. The blue and black two-tone color scheme distinguishes each step, with 'Visual Appealing' text areas below each node for adding step-specific descriptions. This 2-slide presentation (16:9 ratio, PPTX format) is ready to use in business reports, process improvement proposals, and project management presentations.
Usage Points
-
Main Usage
Visualizes repetitive business workflows and operational cycles in construction and project management through six sequential steps. The circular arrangement of nodes clearly represents cyclical processes, making it ideal for explaining business progression stages, quality management cycles, and customer service workflows.
-
How to Use
Add step-specific descriptions, responsible parties, and timelines in the 'Visual Appealing' text areas below each node. Use blue nodes to highlight primary steps and black nodes for supporting steps. Present each stage in clockwise order to enhance audience comprehension of the workflow progression.
-
Recommended For
Recommended for construction and project managers, business development teams, and operations leaders presenting business progression stages, quality assurance processes, and customer engagement cycles. Also suitable for consulting, manufacturing, and service industry process improvement proposals and operational optimization reports.
-
Slide Structure
Six icon nodes arranged in a circular pattern connected by directional arrows forming a complete cycle. Nodes alternate between blue (3) and black (3) tones for visual distinction. Each node includes a 'Visual Appealing' text area for adding descriptions. Two-section layout with title area at top and explanation area at bottom.
Related Products
-

Navigation Program App Process and Implementation Plan - Enhancing Business Performance
#Business Management #Operational Plan #Diagram
-

Denim PPT Connection Diagram – Ideal for Business Management and Operational Plans
#Business Management #Operational Plan #Diagram
-

Execution Plan for Creative Learning Programs – Effective Workflow Diagram
#Business Management #Operational Plan #Diagram
-

Diagram Illustrating the Internet Shopping Process
#Business Management #Operational Plan #Diagram
