Market and Competitor Analysis
Big Data Analysis Graph - An Effective Market Analysis Tool
RJ0400053_10
- Last Update 12/21/2025
- File Size 0.1MB
- # of Slides 2
- File Format PPTX
- Slide Ratio 16:9
- Color
Keywords
About the Product
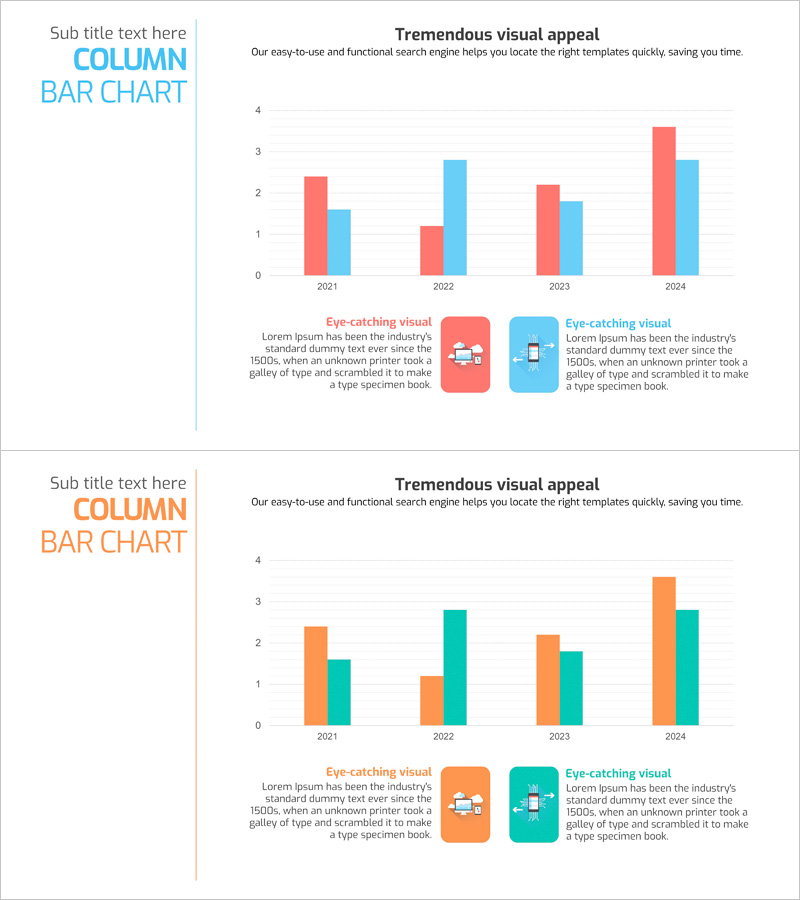
This slide utilizes horizontal and vertical bar charts to intuitively depict market trends and competitor analysis results. The visually effective design facilitates data interpretation and conveys information clearly. The combination of blue and orange colors provides a stylish yet engaging look, making it suitable for corporate market analysis or product presentation materials. It effectively visualizes various data points and competitor comparisons, contributing to business strategy formulation. Text and data fields are easily interchangeable, and the editing difficulty is rated as 'easy', allowing for quick integration into various presentations.
Related Products
-
Sleek Graphs and Charts – Visual Data Communication
#Market and Competitor Analysis #Graph #Competitor Analysis
-
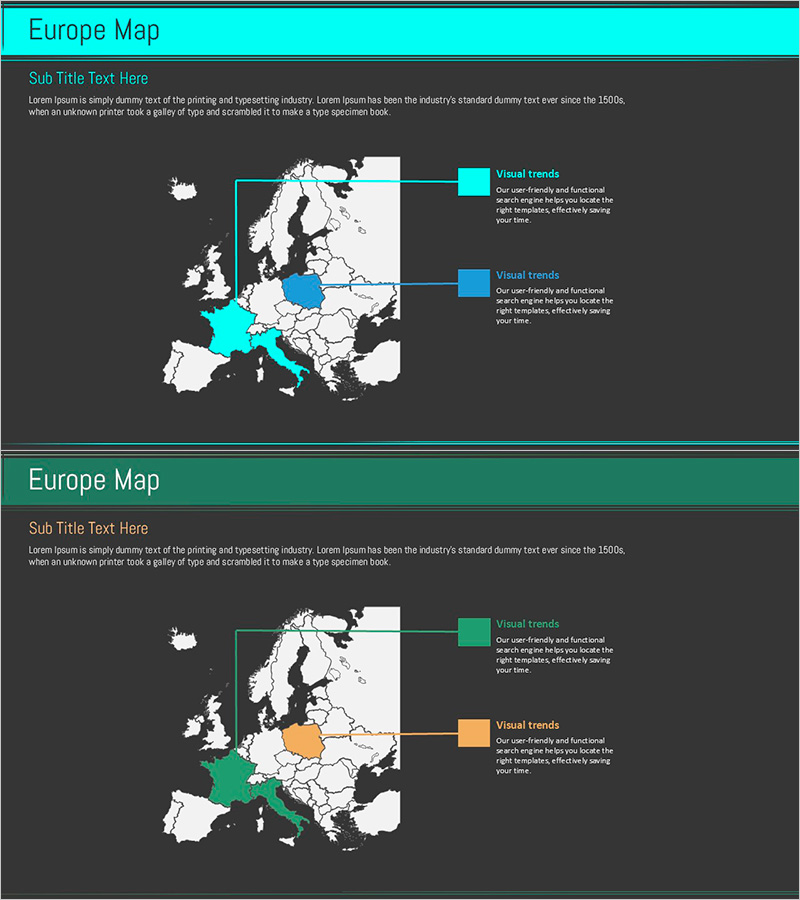
European Target Area Analysis – Market and Competitor Review
#Market and Competitor Analysis #Other #Market Analysis
-
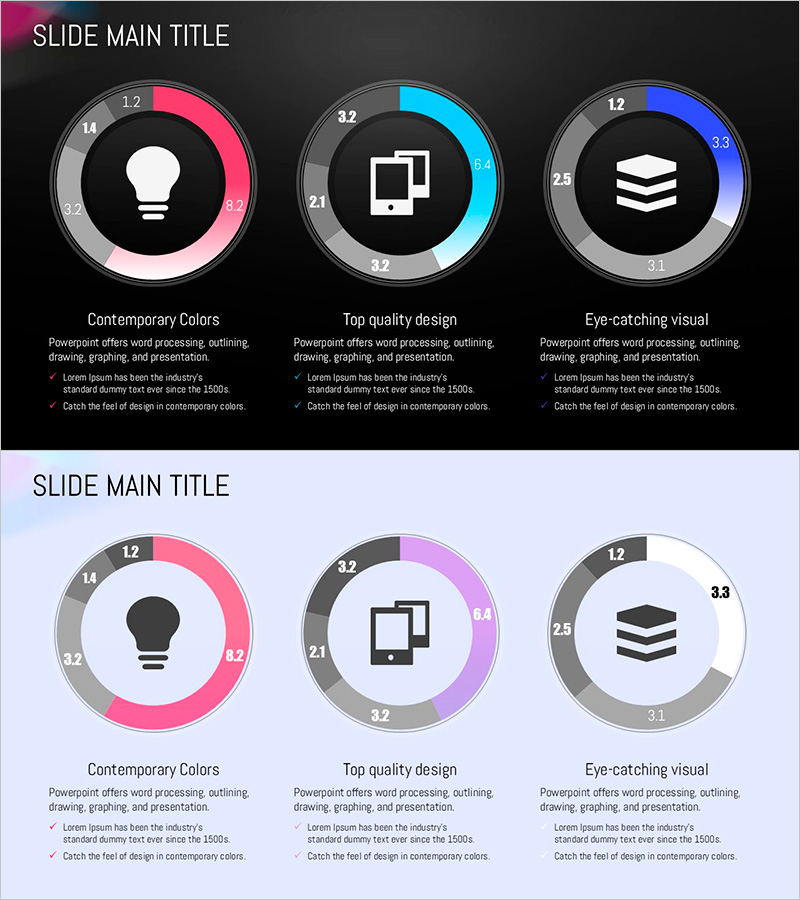
Circular Gradient Wide Template Donut Chart2 – Visualizing Market Analysis and Operational Plans
#Operation Plan #Market and Competitor Analysis #Graph
-
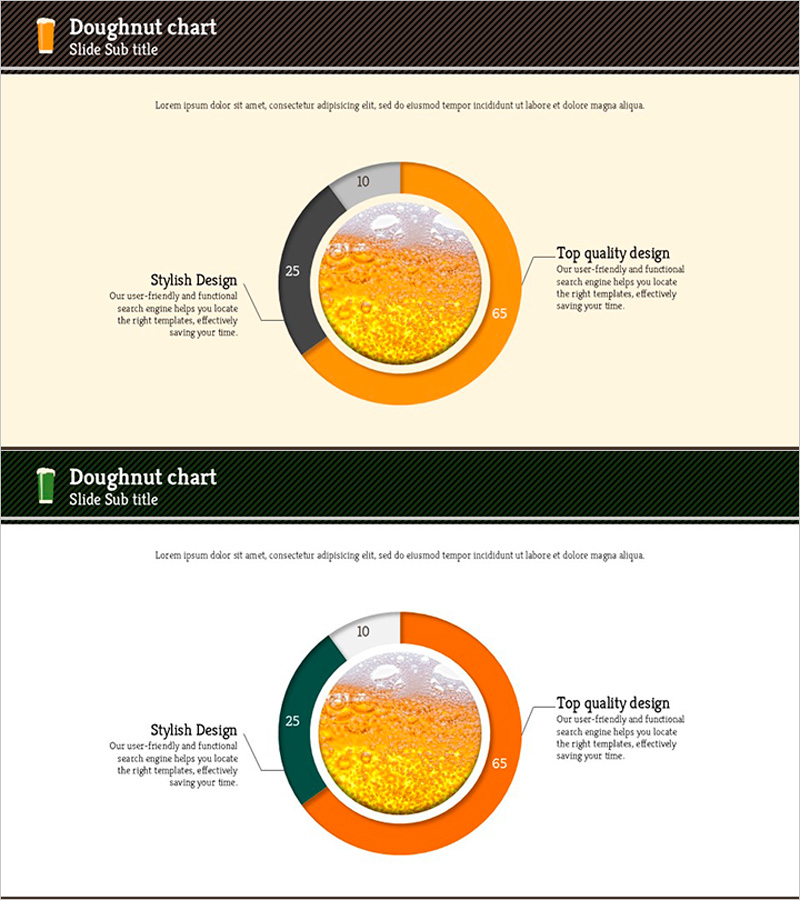
Beer Carbonated Doughnut Chart – Market Share Analysis
#Market and Competitor Analysis #Financial Plans and Performance #Graph
