
Market and Competitor Analysis
Competitor Paired Bar Graph – Market Analysis and Comparison
RJ0400052_13
- Last Update 12/21/2025
- File Size 6.7MB
- # of Slides 2
- File Format PPTX
- Slide Ratio 16:9
- Color
Keywords
About the Product
This slide features a paired bar graph that provides a neat comparison of competitor performance and visual elements. Designed to visually showcase two performance metrics simultaneously, the harmonious colors of black and gray enhance the reliability and professionalism of the data. It is highly effective for analyzing competitive advantage and assessing market position. The slide is well suited for corporate strategy development, investment presentations, and competitive market analysis. With replaceable text and data areas, the editing difficulty is rated as 'easy', making it accessible for anyone to use.
Related Products
-
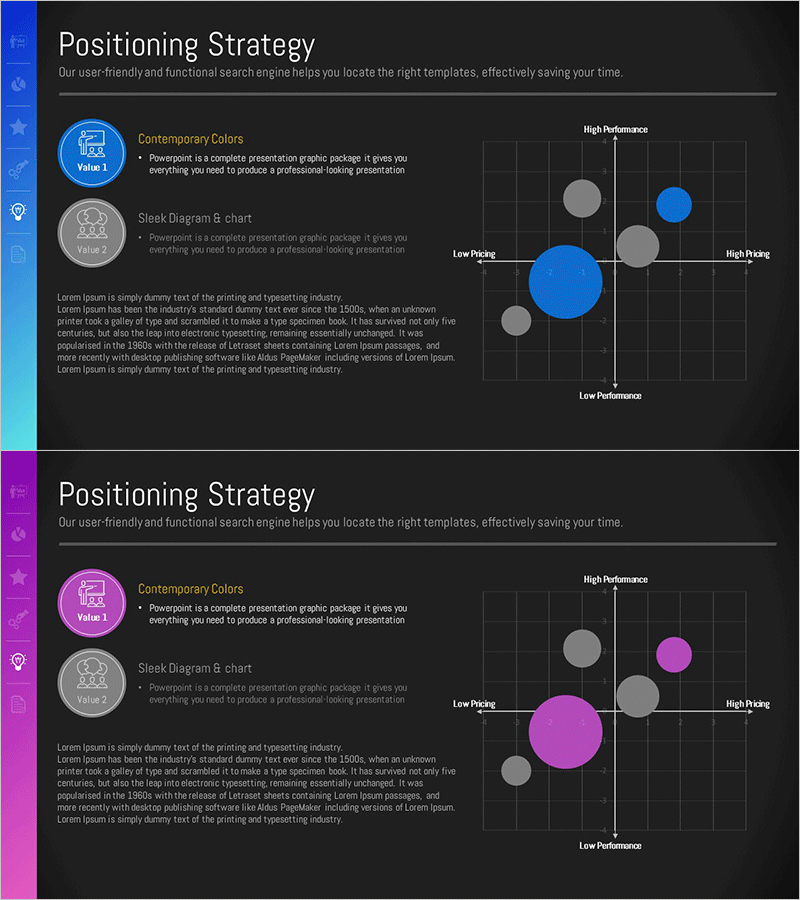
Positioning Map – Market Analysis and Strategy
#Market and Competitor Analysis #Marketing Plan and Strategy #Diagram
-
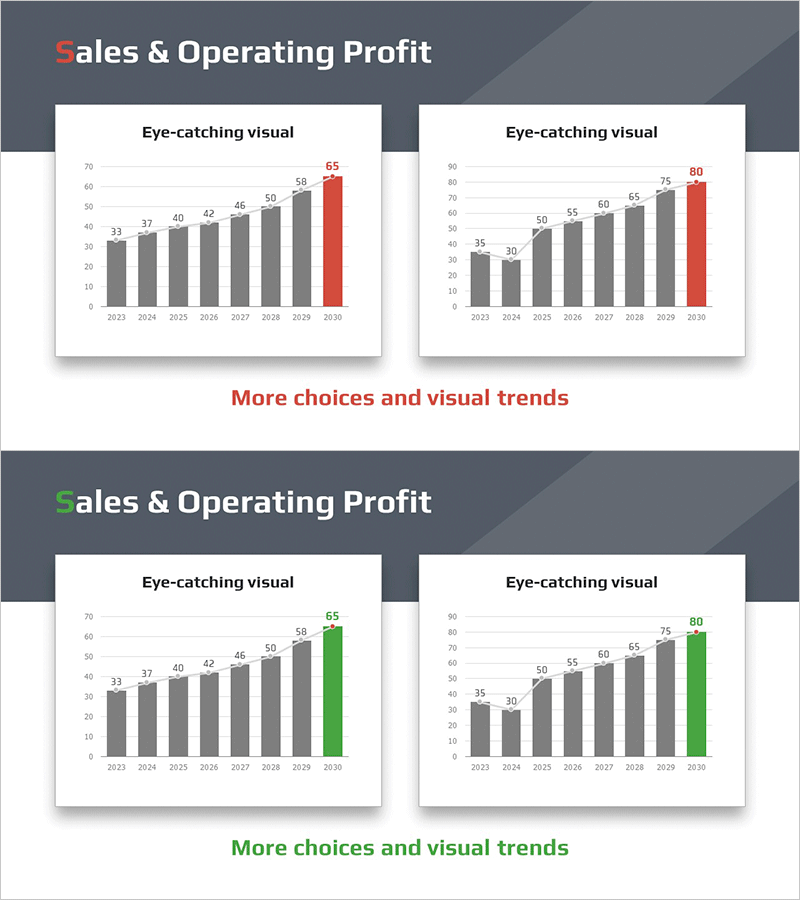
Sales and Profit Growth Trend Analysis Graph – Market and Financial Performance
#Market and Competitor Analysis #Financial Plans and Performance #Graph
-
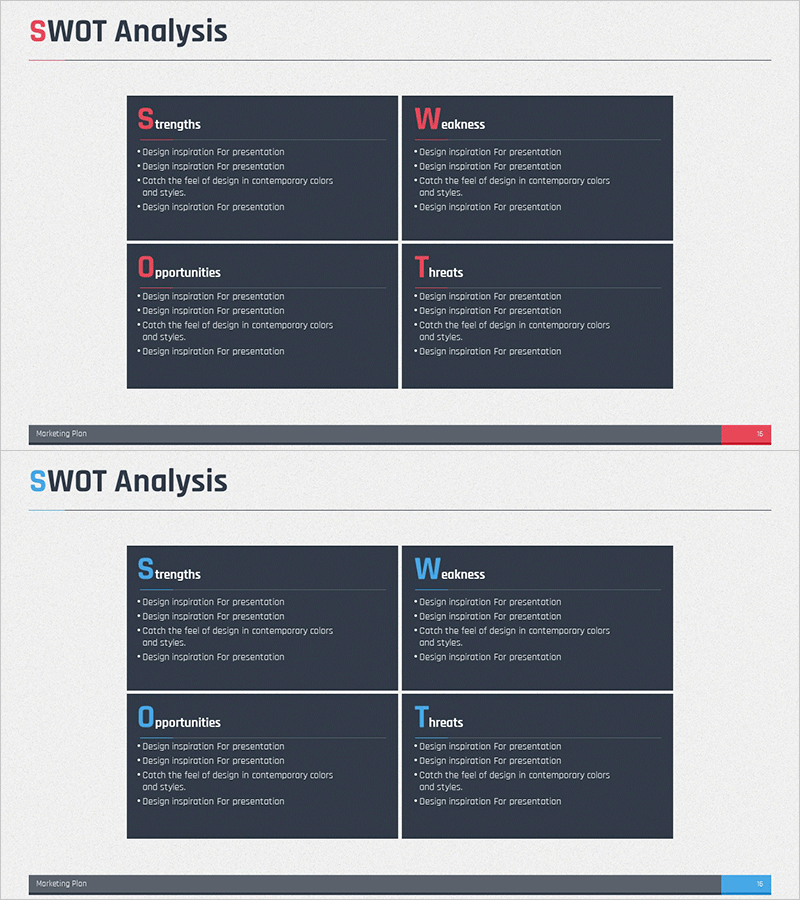
Square Diagram for SWOT Analysis – Effective Market and Competitor Analysis
#Market and Competitor Analysis #Diagram #SWOT Analysis
-
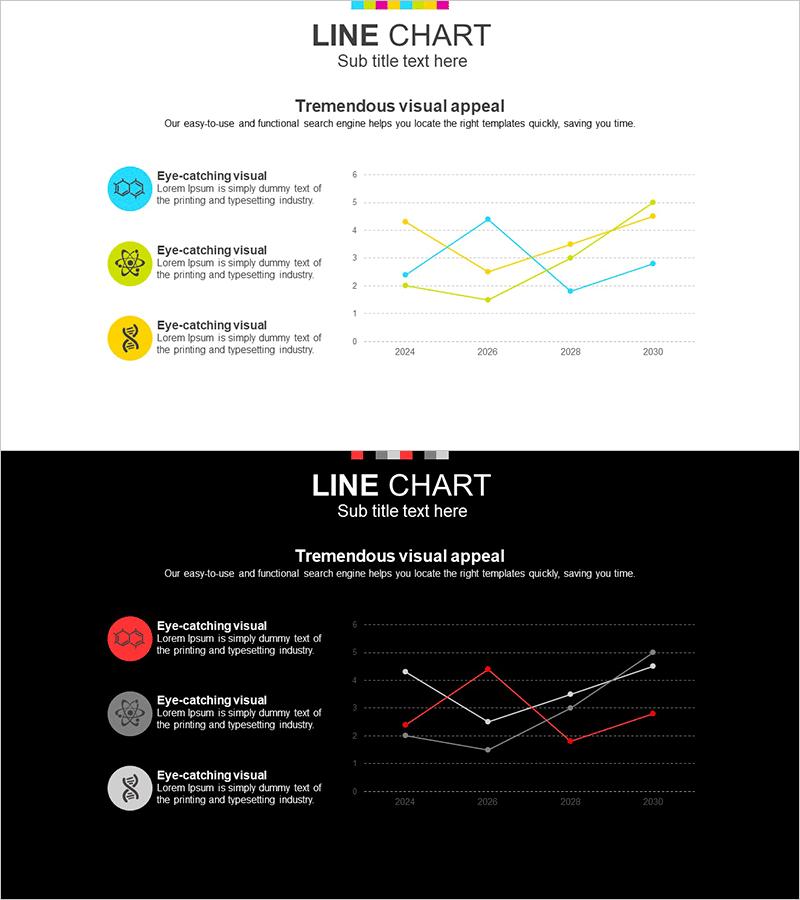
Chemical Experiment Analysis Broken Line Graph – Insights and Data Visualization
#Market and Competitor Analysis #Diagram #Graph
