Market and Competitor Analysis
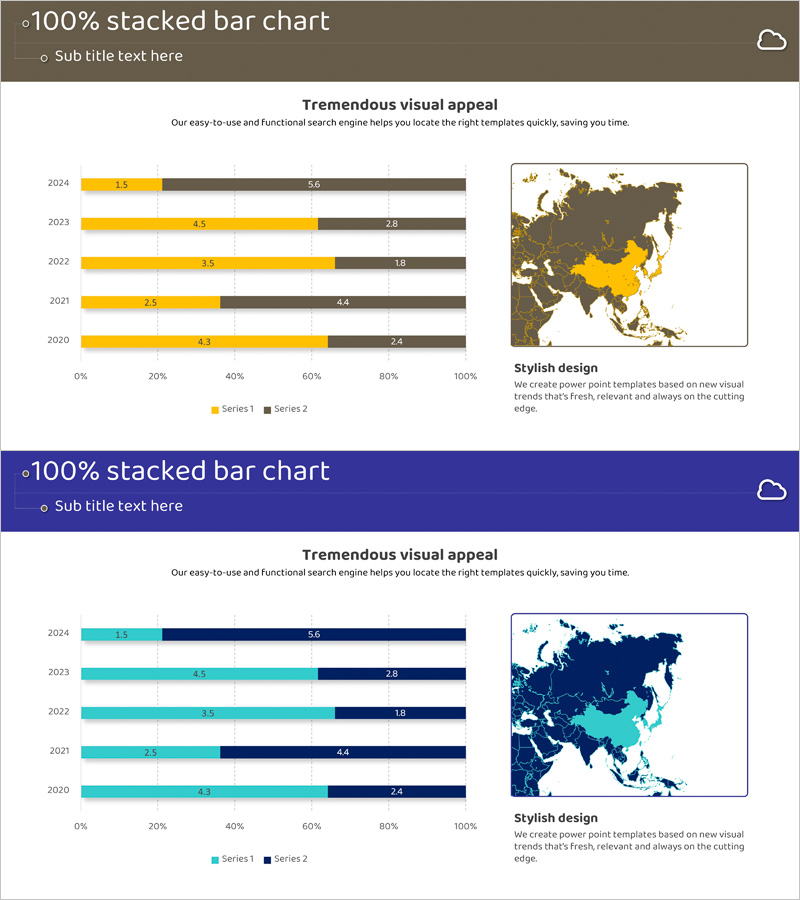
Target Country Year-by-Year Analysis Chart – Data Visualization for Market Analysis
RJ0400049_13
- Last Update 12/21/2025
- File Size 0.7MB
- # of Slides 2
- File Format PPTX
- Slide Ratio 16:9
- Color
Keywords
About the Product
This slide visualizes the target country's year-by-year analysis data in a 100% segmented horizontal bar chart. The harmonious color combination of brown and blue allows for clear data comparison, providing insights essential for decision-making and strategy formulation. This design is suitable for business reports and market comparison materials, conveying a clear emotional message that supports achieving objectives. The editing difficulty is rated as 'easy', offering the advantage of convenient text and data replacement.
Related Products
-
SEO Business Service Description - Modern Design
#Product/Service #Business Introduction #Other
-
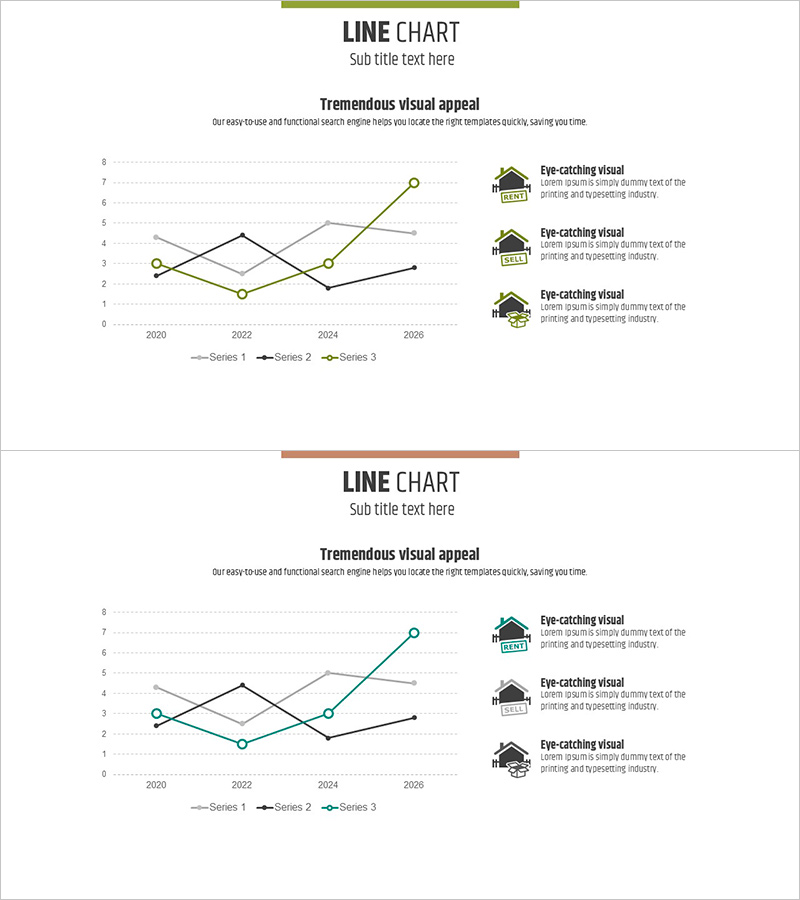
Line Chart to Visualize Real Estate Sales Trends – Market Analysis Strategy
#Marketing Plan and Strategy #Financial Plans and Performance #Graph
-
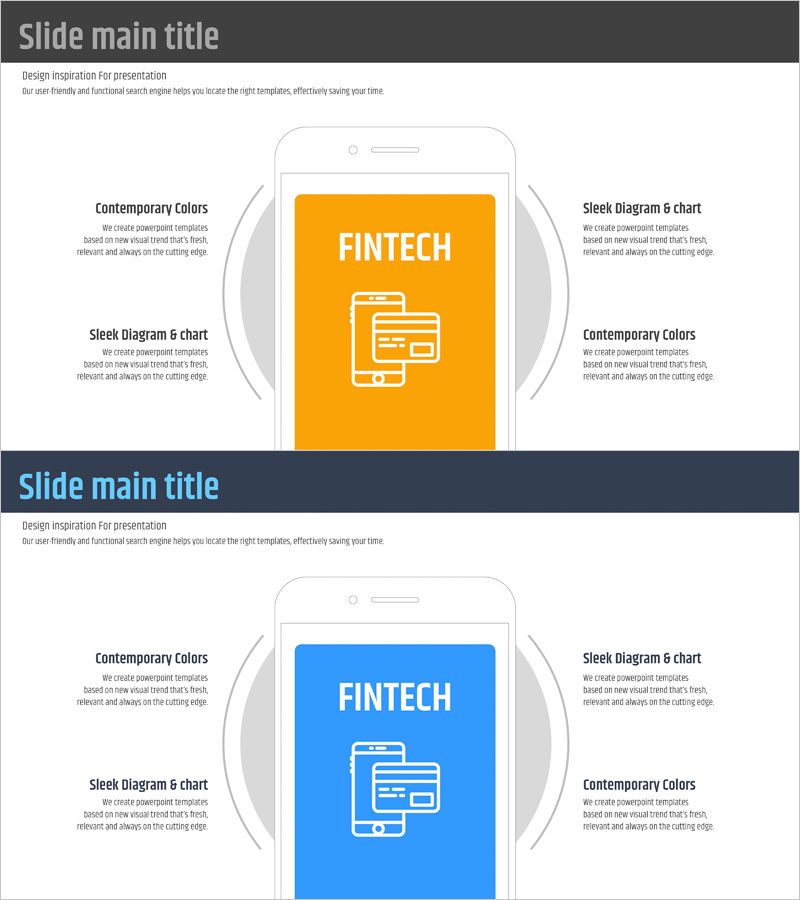
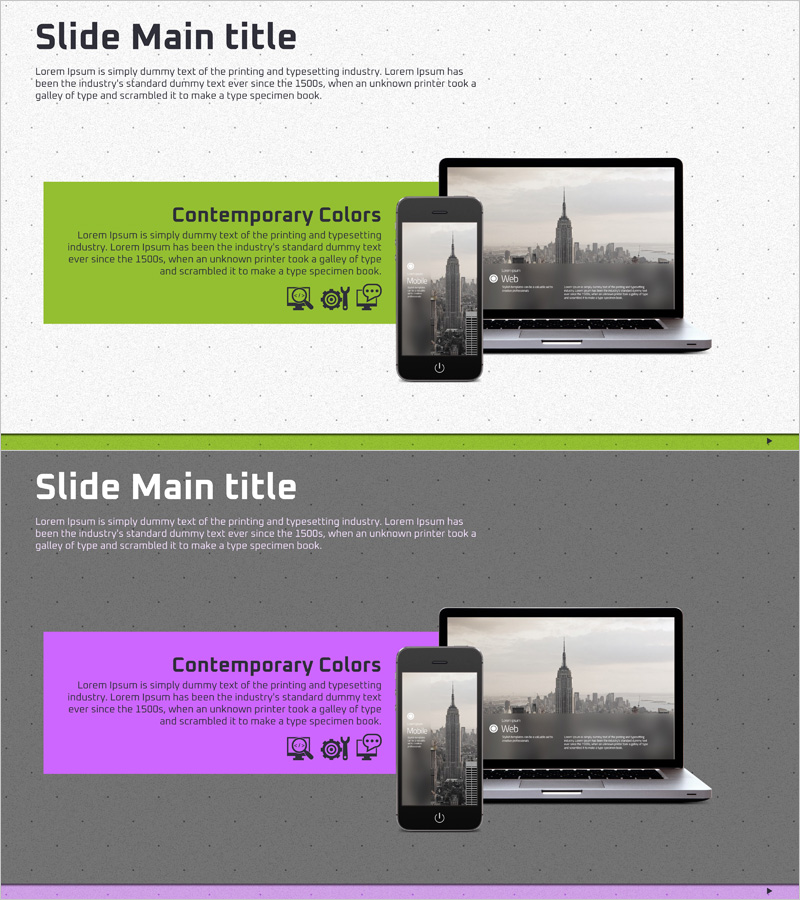
Slide Template Highlighting Fintech Composition
#Company Introduction #Product/Service #Other
-
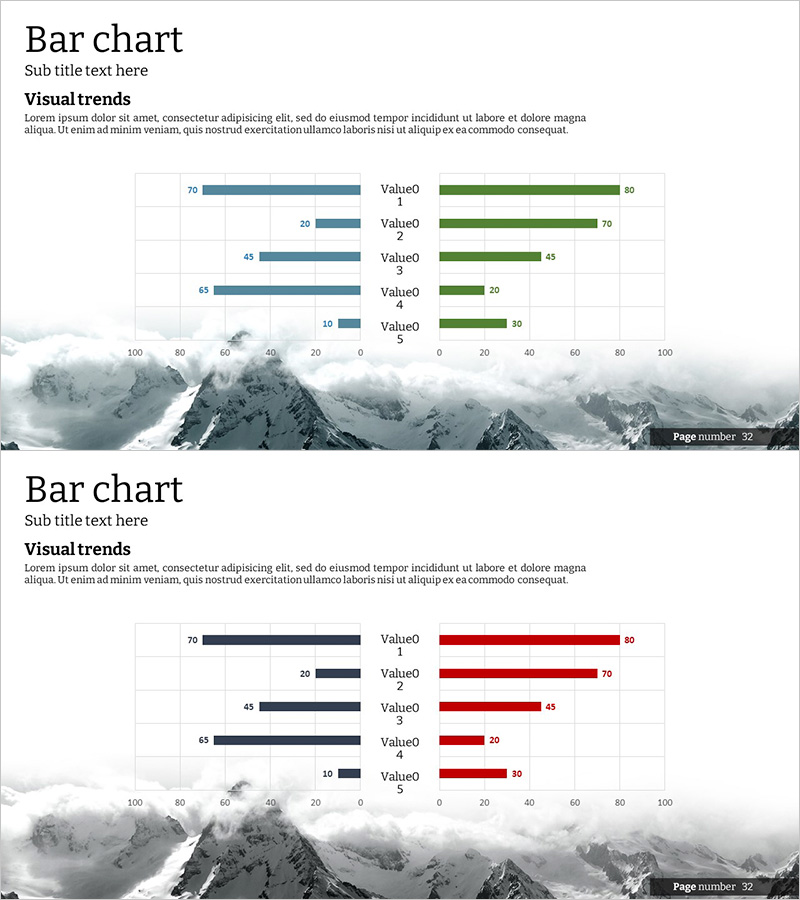
Snow Mountain Theme Double Bar Graph – A Tool for Visualizing Market Analysis
#Market and Competitor Analysis #Graph #Competitor Analysis
