Slide Template Highlighting Fintech Composition
RJ0400058_10
- Last Update 06/02/2025
- File Size 0.2MB
- # of Slides 2
- File Format PPTX
- Slide Ratio 16:9
- Color
Keywords
- #Content-Based Slides
- #Design-Based Slides
- #Company Introduction
- #Product/Service Introduction
- #Other
- #Business Areas
- #Composition
- #16:9
- #fintech PowerPoint slide
- #fintech composition diagram
- #mobile financial services slide
- #fintech presentation template
- #how to create fintech architecture diagram in PowerPoint
About the Product
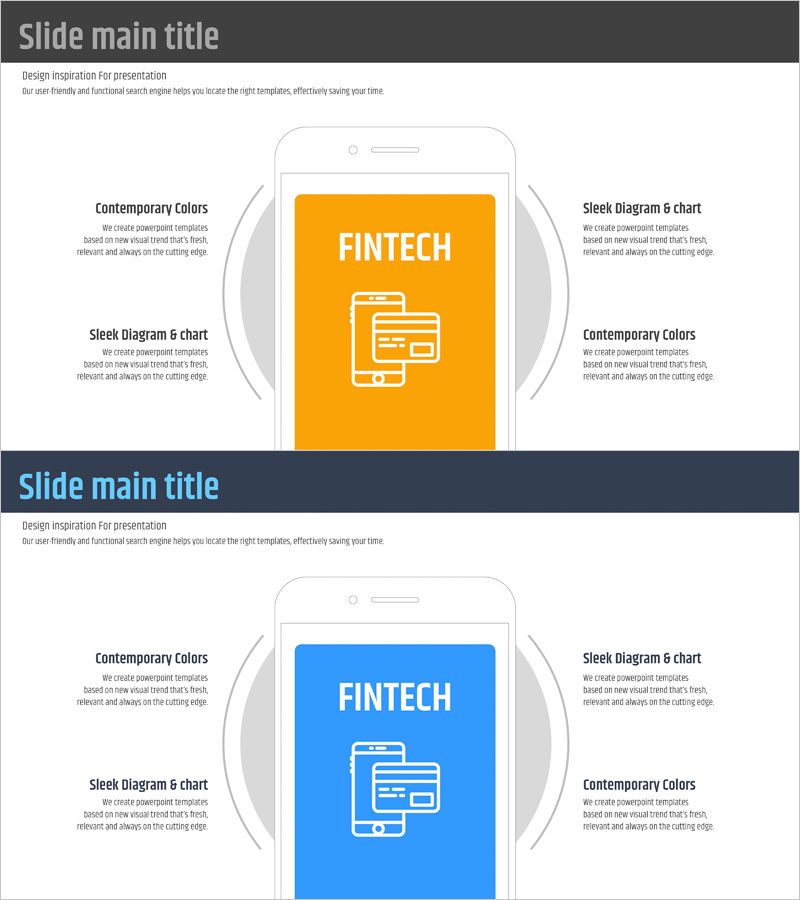
A 2-slide PowerPoint presentation template that visually explains fintech service architecture with a mobile-centric design. The layout features a central mobile device image flanked by four symmetrical text areas (Contemporary Colors and Sleek Diagram & chart elements on each side) to clearly organize information hierarchy. Available in two color versions—orange and blue—allowing you to match your corporate brand identity. Ideal for fintech pitch decks, IT solution proposals, digital transformation presentations, and technology investor briefings where clear service composition visualization is essential.
Usage Points
-
Main Usage
Visually communicate fintech service architecture and core components to investors, partners, and clients through a mobile-first perspective. The symmetrical composition balances information presentation and reinforces credibility in technology-focused pitches.
-
How to Use
Deploy in fintech solution proposals, IT company overviews, digital transformation strategy presentations, and technology investor briefings. Customize by placing technical features on the left and user experience on the right, or core functions above with supporting systems below for layered information delivery.
-
Recommended For
Fintech startups, financial technology solution providers, IT consulting firms, digital banking teams, technology investment presenters, and digital innovation project leaders explaining service composition and system architecture.
-
Slide Structure
Two-slide deck with each slide centered on a mobile device image surrounded by four symmetrical text zones (two Contemporary Colors and two Sleek Diagram & chart areas). Provided in orange and blue color variants to align with brand guidelines and visual preferences.
Related Products
-

Online Shopping Mall Composition Diagram – Data Visualization
#Product/Service Introduction #Diagram #Other
-

Global IT Financial Services Overview – Leveraging the Latest Trends
#Product/Service Introduction #Diagram #Other
-

Target Area Goals & Mobile Mockups – Visualization of Marketing Strategies
#Product/Service Introduction #Marketing Plan and Strategy #Diagram
-

Mobile Service Configuration Introduction – Visualized with Cluster Format
#Product/Service Introduction #Diagram #Other
