Market and Competitor Analysis
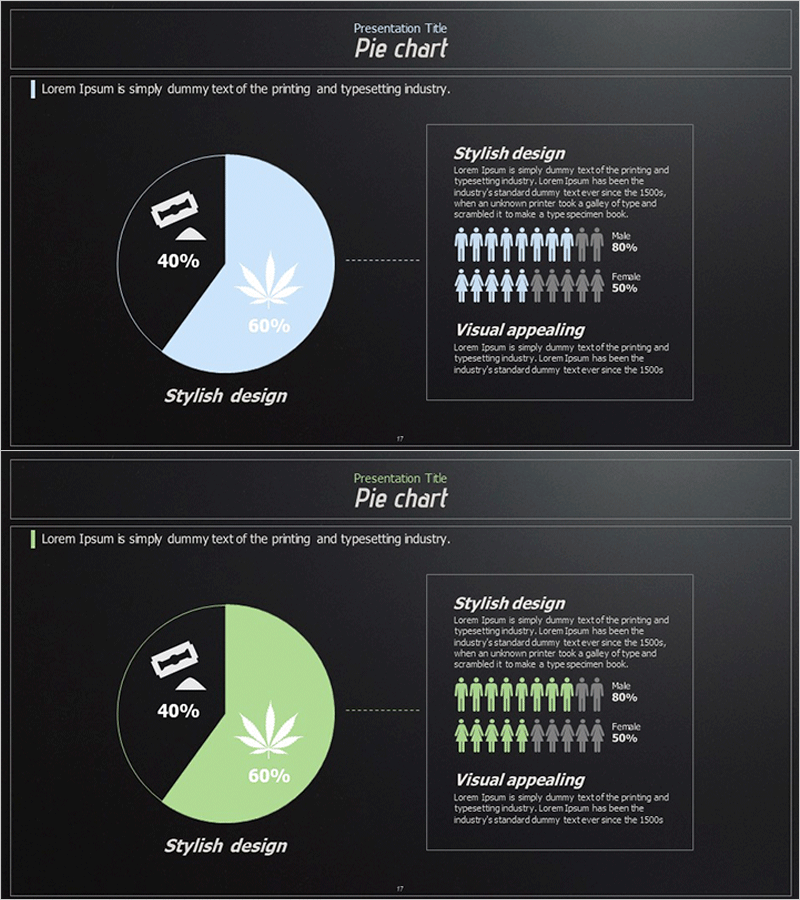
Drug Addiction Gender Ratio Analysis Graph - Customer Analysis
RJ0400047_16
- Last Update 12/21/2025
- File Size 1.5MB
- # of Slides 2
- File Format PPTX
- Slide Ratio 16:9
- Color
Keywords
About the Product
This slide visually represents the gender ratio of drug addiction using a pie chart, intuitively displaying the comparison between male and female percentages. The graph indicates that 60% are male and 40% are female. This design effectively communicates information and is suitable for presentations on customer analysis and market share. Users can quickly comprehend the data through a visually cohesive structure. Text and other editable elements are easy to replace, with an overall editing difficulty rated as 'easy'.
Related Products
-
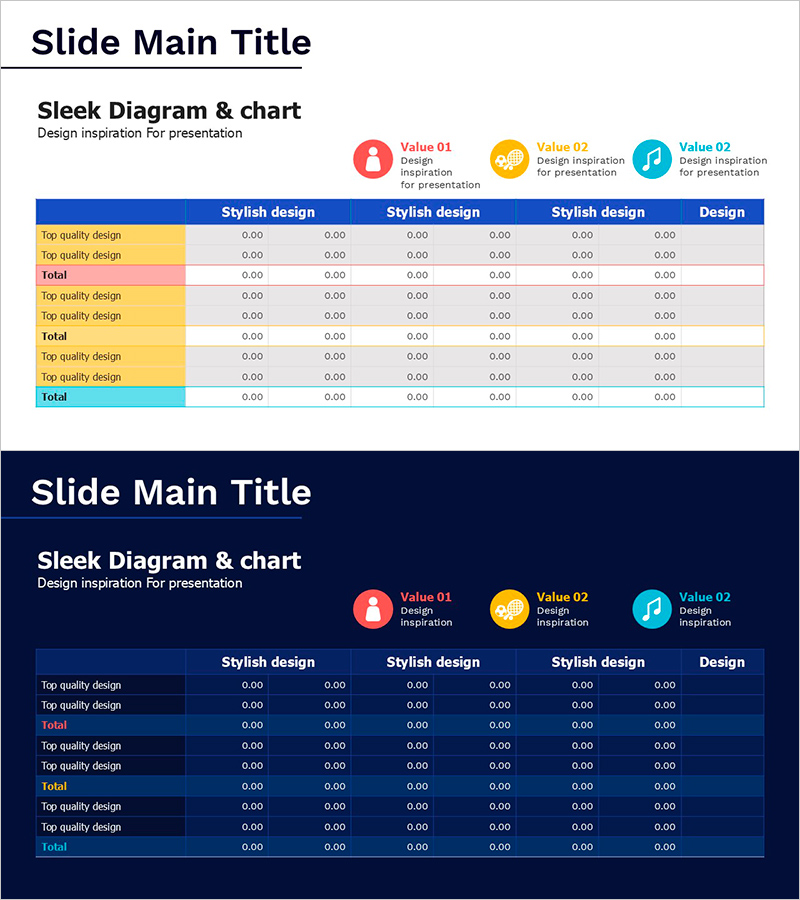
Game Data Analysis Table – Market Analysis and Trends
#Product/Service #Market and Competitor Analysis #Diagram
-
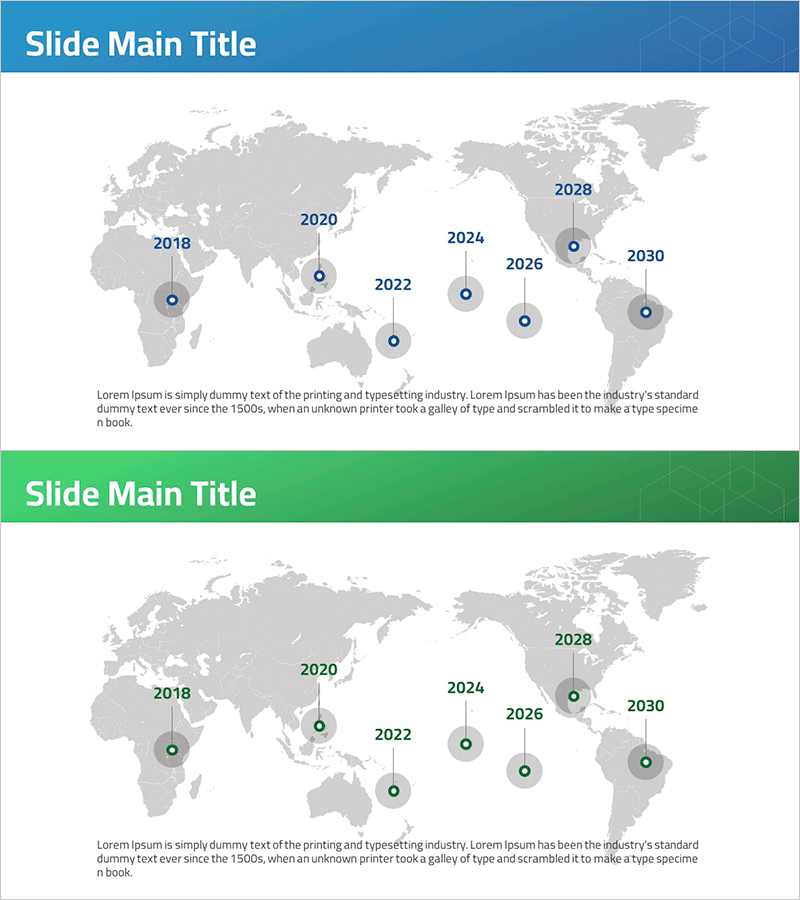
Yearly Global Map Slide for Visualizing Global Network
#Company Introduction #Other #Global Network
-
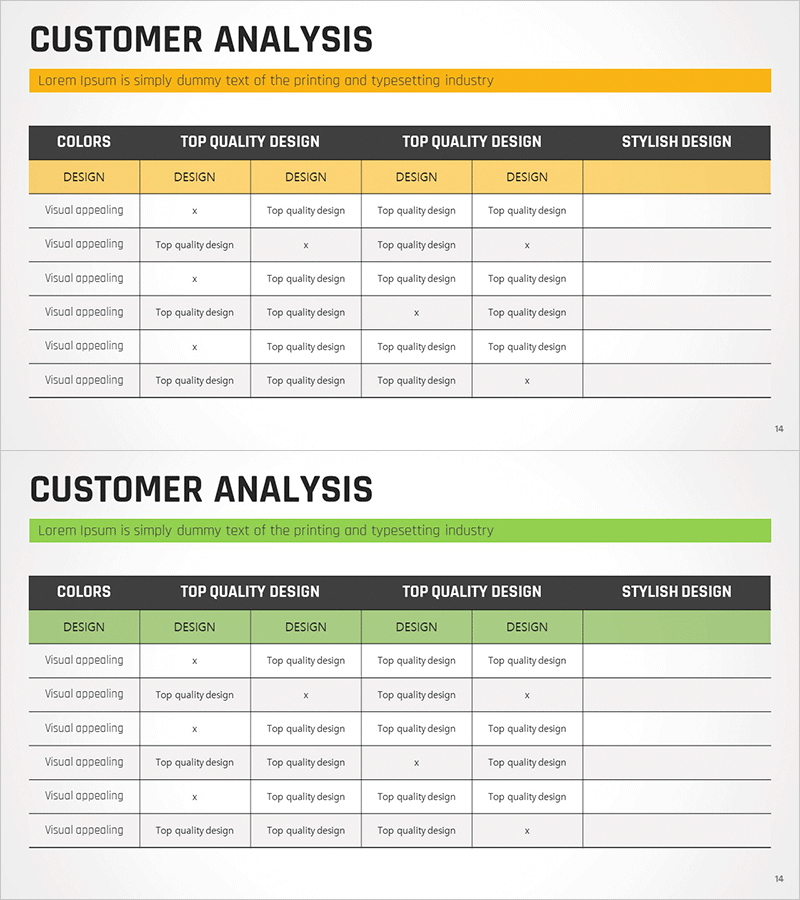
Competitor Analysis Table Slide – The First Step to Market Understanding
#Market and Competitor Analysis #Diagram #Competitor Analysis
-
Latest Numeric Highlight Bar Chart – Visualizing Business Growth
#Graph
