Business Introduction
Long-term Status Circular Graph
RJ0400037_6
- Last Update 12/21/2025
- File Size 6MB
- # of Slides 2
- File Format PPTX
- Slide Ratio 16:9
- Color
Keywords
About the Product
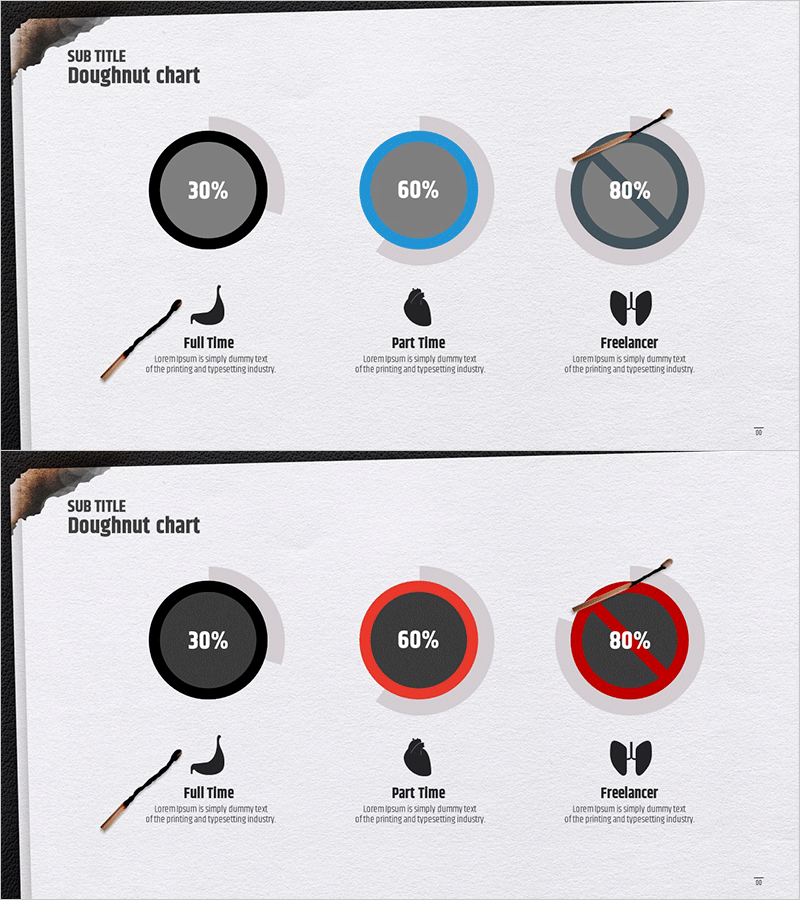
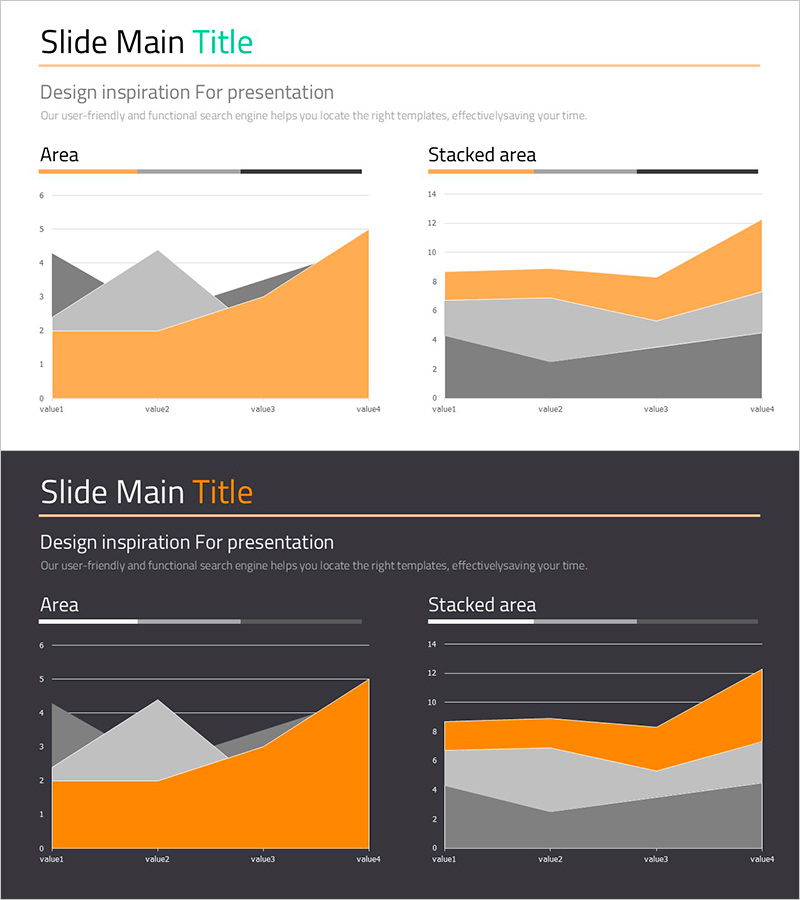
This slide features a circular graph template designed to effectively convey the long-term status overview. The visually intuitive doughnut chart structure clearly illustrates the proportions of each status, making data comparisons straightforward. The mix of blue, red, and gray enhances reliability and professionalism, suitable for various business contexts, such as project planning or corporate reports. The slide is easy to edit, allowing for quick updates on the organization's technology status and progress.
Related Products
-
Healthy Food Diffusion Diagram – Organic Connection
#Product/Service #Business Introduction #Diagram
-
Competitor Progress Comparison Analysis Graph – Essential Tool for Market Analysis
#Market and Competitor Analysis #Graph #Competitor Analysis
-
Three-Color Line Chart - Visualizing Competitive Advantage
#Market and Competitor Analysis #Graph #Competitive Advantage
-
Free Orange Area Chart – A New Approach to Data Visualization
#Graph
