Market and Competitor Analysis
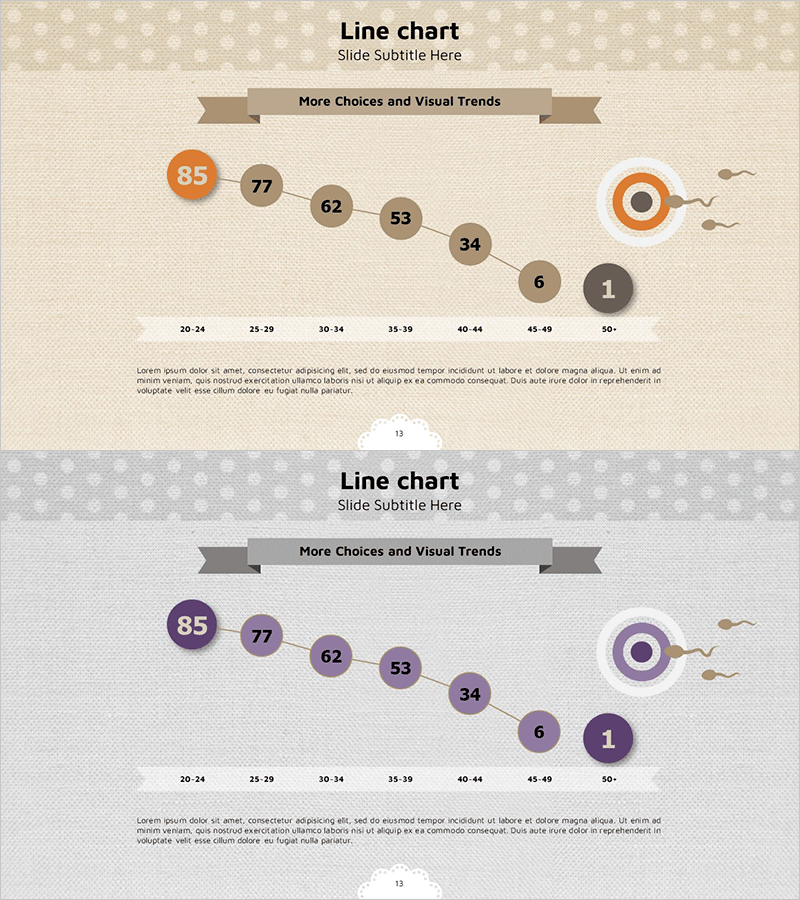
Childbirth Age Comparison Analysis Graph – Market Status and Forecast
RJ0400030_12
- Last Update 12/21/2025
- File Size 8.7MB
- # of Slides 2
- File Format PPTX
- Slide Ratio 16:9
- Color
Keywords
About the Product
This slide utilizes a line graph for childbirth age comparison, effectively communicating changes in data. The overall design offers a modern feel complemented by a harmonious blend of brown and purple colors, conveying stability. The graph illustrates the childbirth age distribution from the early 20s to the 50s, visually representing market trends and future predictions. This slide is suitable for policy presentations, research findings dissemination, and discussions on societal issues, with easy data point updates resulting in a low editing difficulty. It is a valuable addition for any strategic presentation.
Related Products
-

Transforming Business Operations with SaaS Integration – Discover More
#Product/Service #Business Introduction #Diagram
-
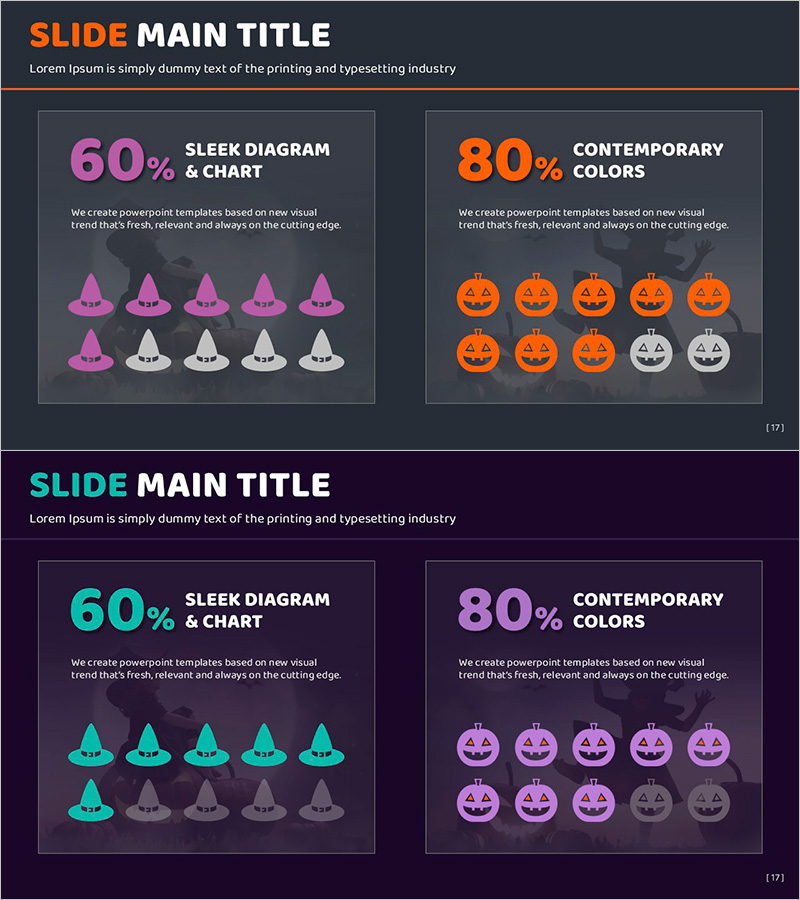
Halloween Hats and Pumpkin Charts – Ideal for Market Analysis
#Market and Competitor Analysis #Graph #Other
-

PC Mockup with Diagonal Background – Contemporary Design Feel
#Marketing Plan and Strategy #Risk Management and Regulatory Compliance #Other
-
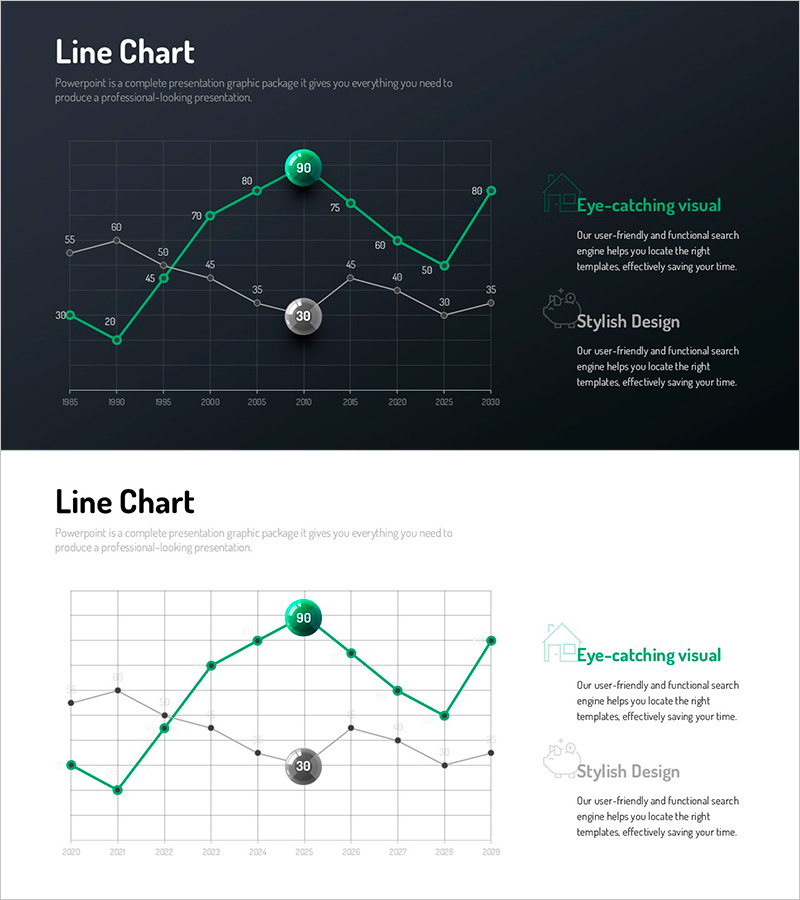
Infographic Design Wide Template Line Chart
#Market and Competitor Analysis #Marketing Plan and Strategy #Graph
