Business Vision and Strategy
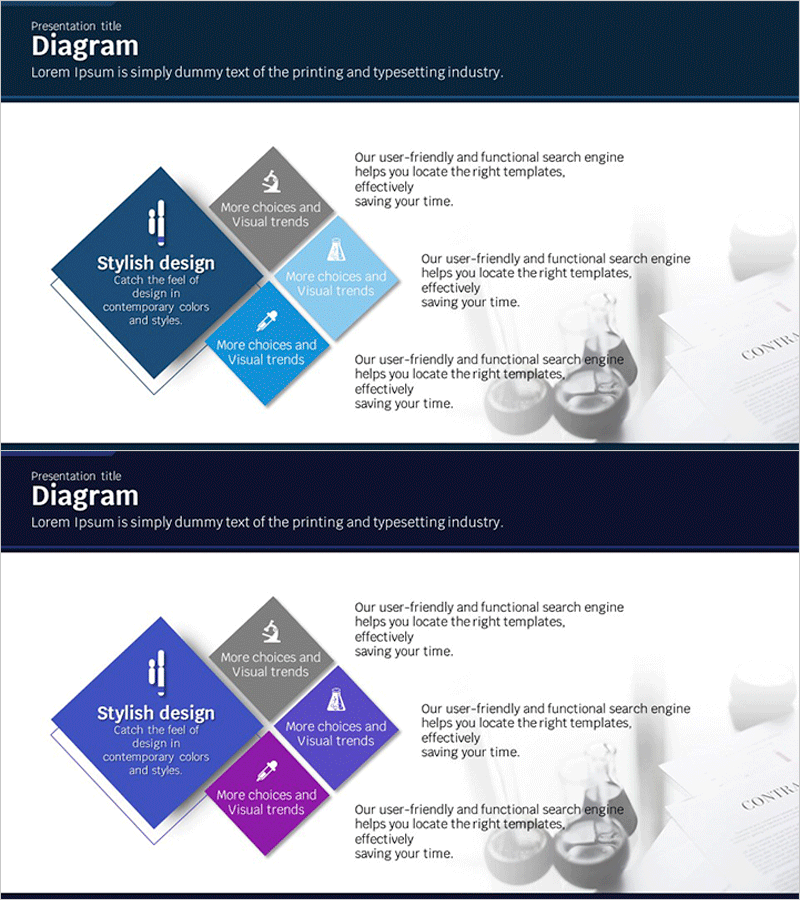
Science Experiment Core Competency Diagram
RJ0400019_18
- Last Update 12/21/2025
- File Size 1MB
- # of Slides 2
- File Format PPTX
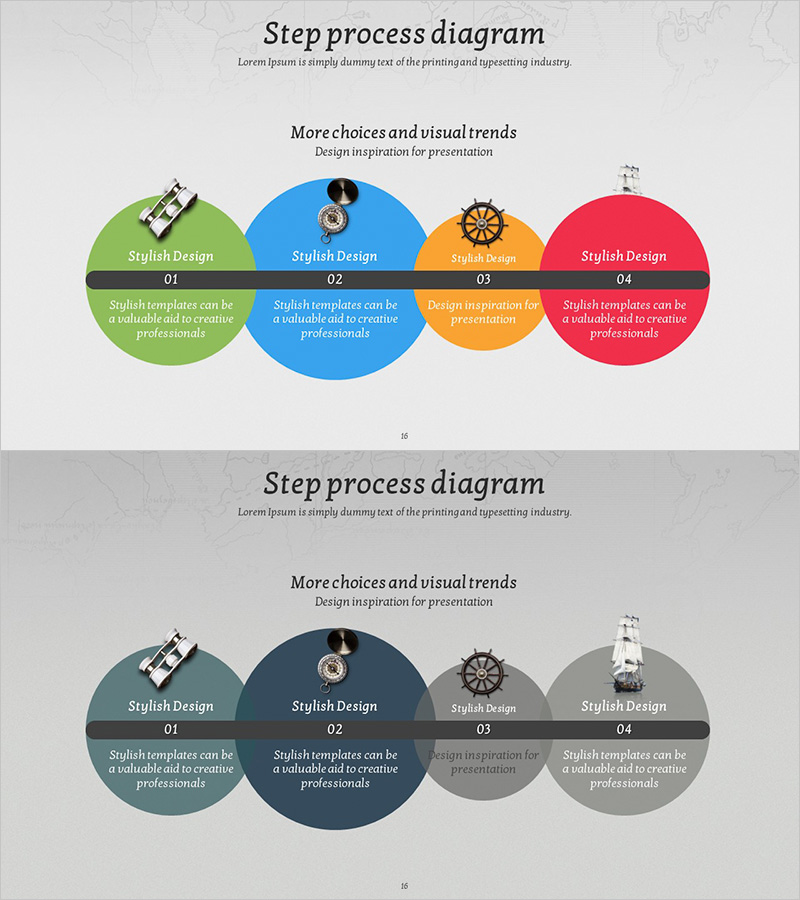
- Slide Ratio 16:9
- Color
Keywords
About the Product
This slide features a cluster diagram visually representing the core competencies of science experiments. The harmonious blue and purple colors create a professional and sophisticated impression, making it highly effective for summarizing various experimental techniques and outcomes. It is particularly suitable for business or educational presentations to enhance the audience's understanding and effectively emphasize core messages. Users can clearly convey experimental themes through this slide, with easy text and graphic replacements, rated as 'easy' for editing, allowing for quick integration into various presentations.
Related Products
-
Create Financial Plans with a Simple Sky Table
#Financial Plans and Performance #Diagram #Balance Sheet
-
Energy Business Area – Business Introduction Diagram
#Company Introduction #Business Introduction #Diagram
-
Flow Diagram Visualizing Future Achievement Goals and Strategies
#Business Vision and Strategy #Marketing Plan and Strategy #Diagram
-
Visual Process Diagram for Step-by-Step Schedule Planning
#Product/Service #Business Promotion Strategy #Diagram
