Visual Process Diagram for Step-by-Step Schedule Planning
RJ0600055_15
- Last Update 07/05/2025
- File Size 5.9MB
- # of Slides 2
- File Format PPTX
- Slide Ratio 16:9
- Color
Keywords
- #Content-Based Slides
- #Design-Based Slides
- #Product/Service Introduction
- #Business Strategy
- #Diagram
- #Product/Service Introduction
- #Step-by-Step Schedule Plan
- #Cluster
- #Combination Diagram
- #Chain Diagram
- #16:9
- #circular process diagram
- #4-step PowerPoint slide
- #process flow diagram
- #schedule planning slide
- #cycle diagram PowerPoint
About the Product
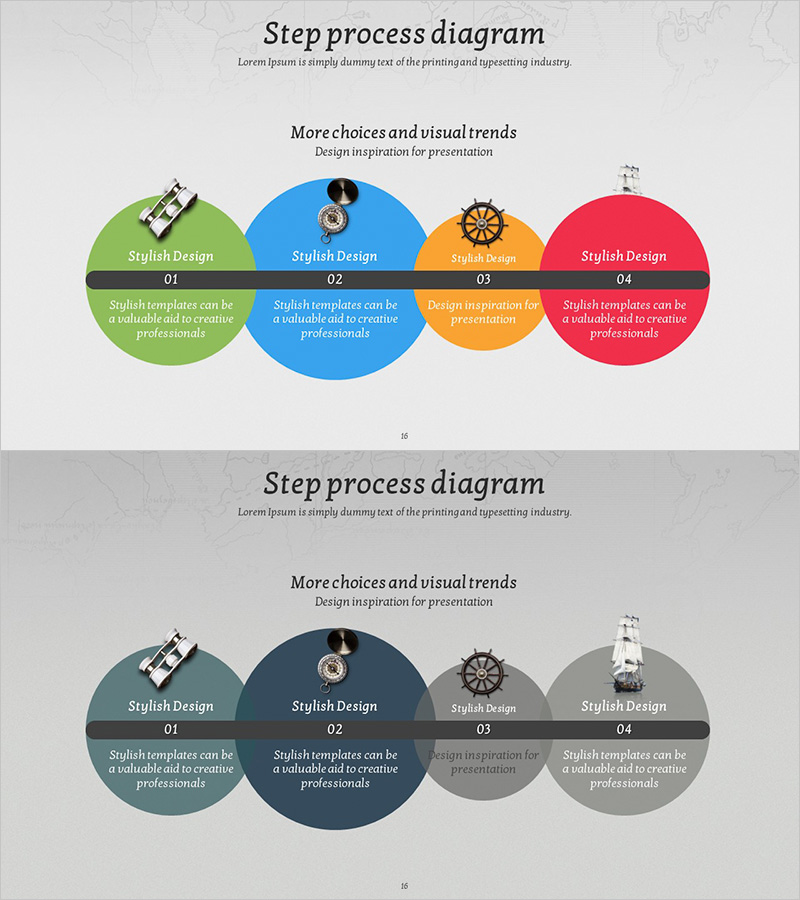
A 4-step circular process diagram PowerPoint slide designed to visualize business planning and schedule management. Features colorful circular nodes in green, blue, orange, and red with icons, each accompanied by descriptive text areas. The 2-slide set includes a horizontal layout for left-to-right progression and a semicircular layout emphasizing cyclical flow. Ideal for presentations on project phases, business timelines, marketing campaign roadmaps, and operational workflows. Fully editable shapes and text fields allow quick customization for your specific process steps.
Usage Points
-
Main Usage
Communicate multi-phase business processes, project timelines, and marketing campaigns through a clear 4-step circular structure. The combination of icons, step numbers, and descriptive text enhances audience comprehension and maintains engagement throughout your presentation.
-
How to Use
Slide 1 displays a horizontal layout showing left-to-right process progression, while Slide 2 uses a semicircular arrangement to emphasize cyclical nature. Edit node text with phase names, timelines, or responsible parties. Replace icons to match each phase's key activities or deliverables.
-
Recommended For
Perfect for business plans, marketing strategies, project proposals, and investor pitch decks. Use in sections explaining implementation timelines, strategic phases, campaign roadmaps, or operational cycles. Suitable for executive presentations, team briefings, and client meetings.
-
Slide Structure
Four circular nodes (approximately 120px diameter) arranged horizontally or semicircularly. Each node contains an icon (40×40px) at top, step number (01–04) in center, and editable text area (80×60px) at bottom. Black connecting lines between nodes represent the circular flow.
Related Products
-

Action Steps for Dreams Slide Template – Visual Appeal and Creativity
#Product/Service Introduction #Business Strategy #Diagram
-

Medical Step-by-step Nesting Diagram – Business Strategy Development
#Business Strategy #Diagram #Step-by-Step Schedule Plan
-

Visualizing Work Process Operation Plan – Adventure and Strategy
#Business Vision and Strategy #Business Strategy #Diagram
-

Business System Procedure Diagram – Step-by-Step Business Strategy
#Business Strategy #Diagram #Step-by-Step Schedule Plan
