Market and Competitor Analysis
Customer Analysis People Icon Graph – Insights and Data Visualization
RJ0400015_8
- Last Update 12/21/2025
- File Size 0.6MB
- # of Slides 2
- File Format PPTX
- Slide Ratio 16:9
- Color
Keywords
About the Product
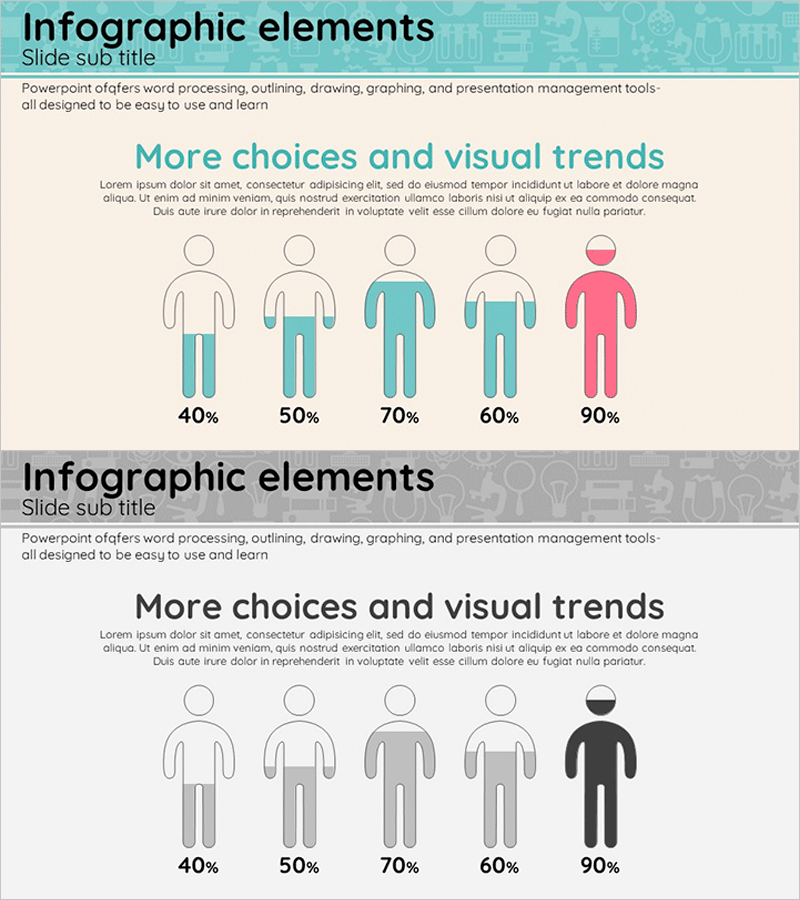
This slide utilizes a people icon graph to visually present customer analysis data. The intuitive design is suitable for customer segmentation, satisfaction analysis, and conveying insights, while the harmonious color scheme of teal and gray provides a professional touch. The slide layout features a title at the top and an array of icons and graphs at the bottom for clear messaging. This is particularly useful for analyzing customer behavior patterns and preferences, making it applicable in marketing strategy sessions or business development meetings. It allows for easy text and icon replacement, enhancing practicality.
Related Products
-
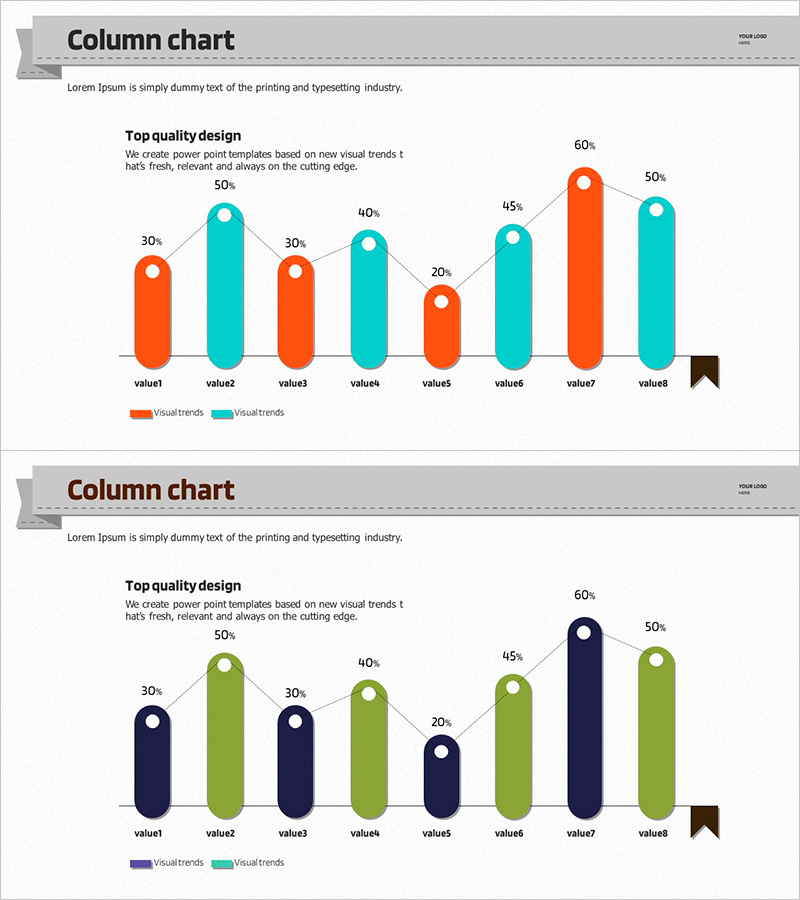
Simple Mixed Rounded Vertical Bar Graph – Intuitive Representation of Market Status
#Market and Competitor Analysis #Graph #Other
-
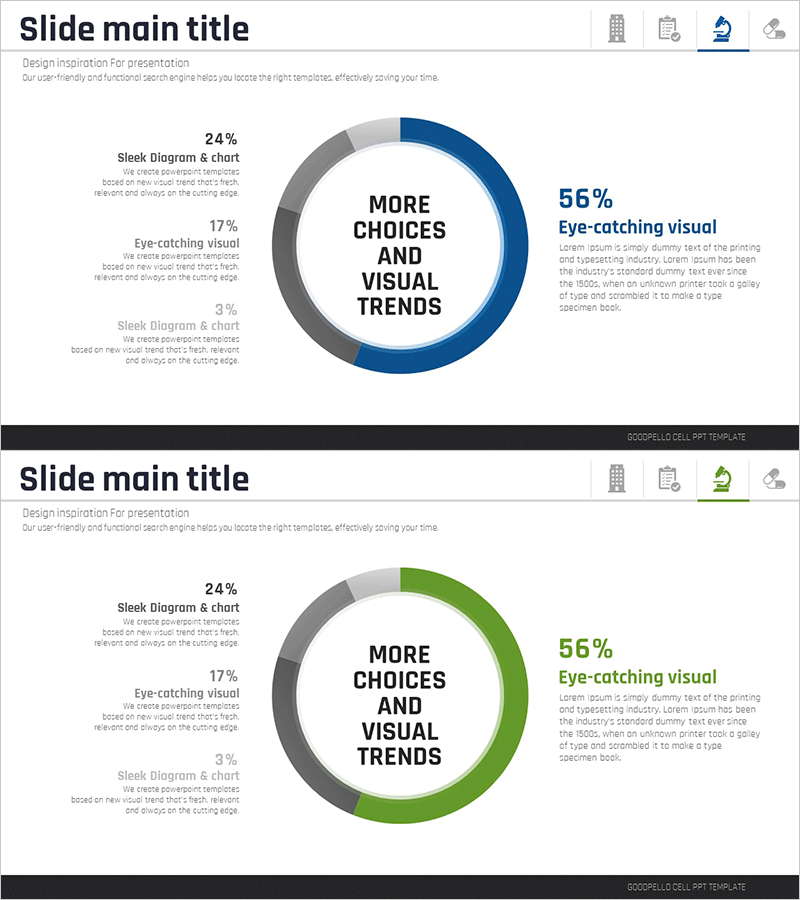
Medical Donut Circle Graph – Effective Market Analysis
#Market and Competitor Analysis #Graph #Market Analysis
-
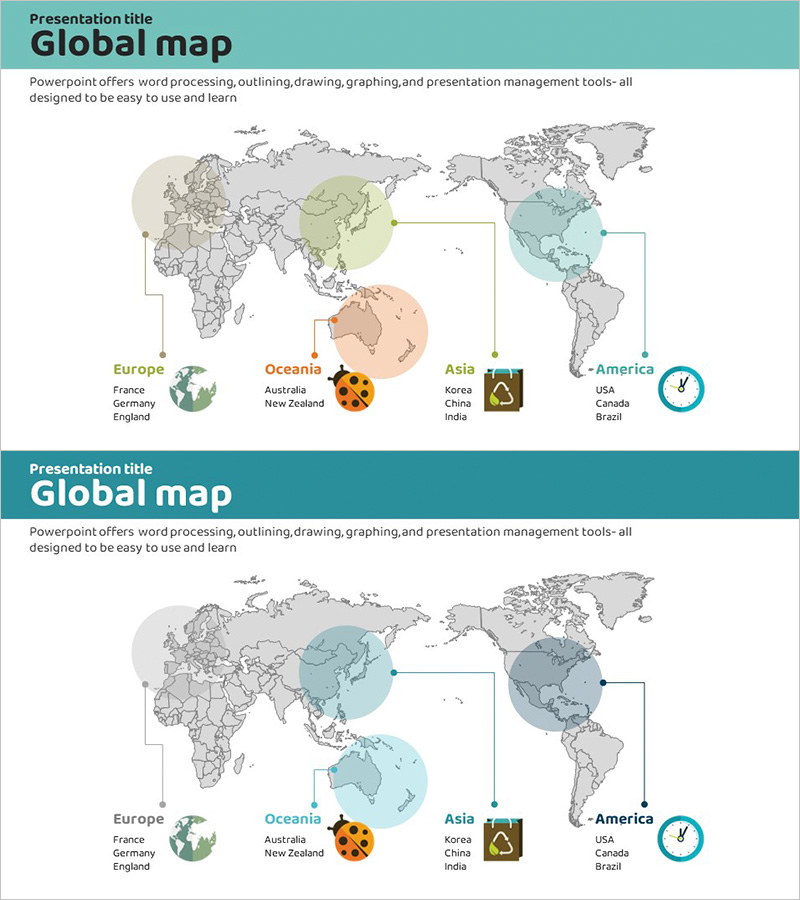
Carbon Neutral World Map for Overseas Market Analysis – Guidelines for Greenhouse Gas Reduction
#Market and Competitor Analysis #Other #Market Analysis
-
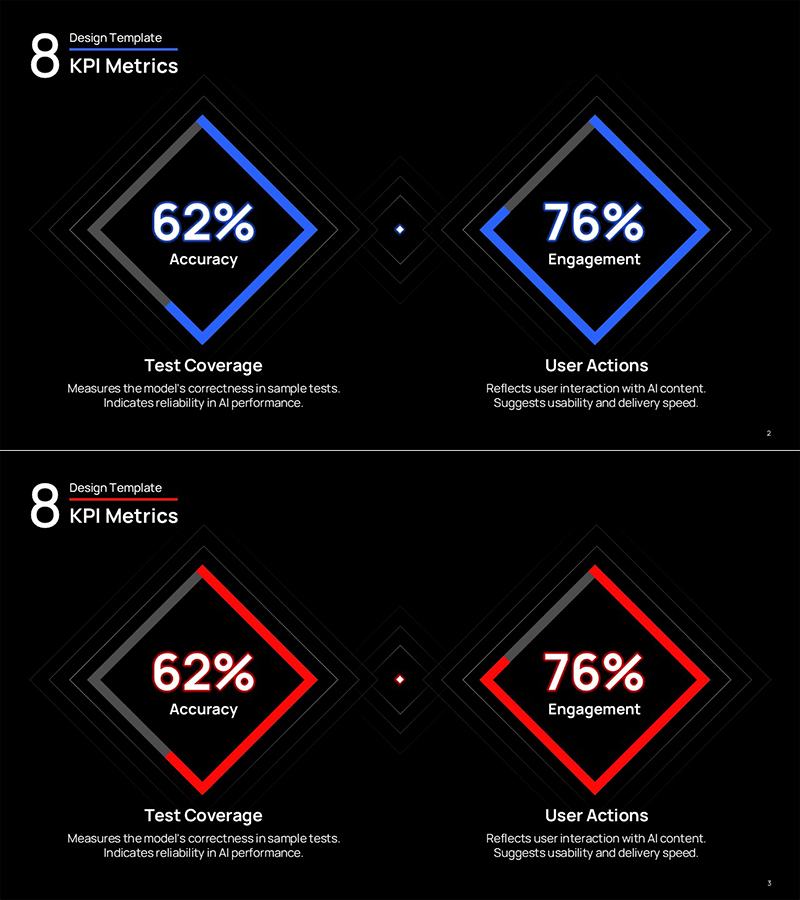
AI Neon Rhombus Visual Template – KPI Metrics Visualization
#Product/Service #Graph #Features
