Market and Competitor Analysis
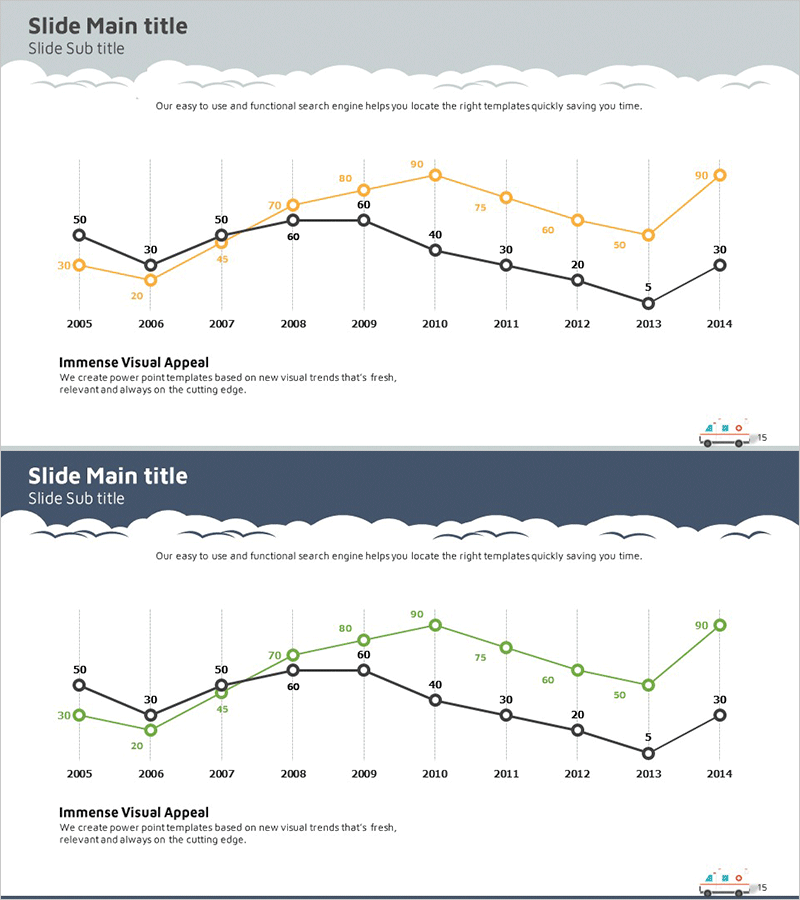
Competitor Analysis Broken Line Graph – Visualizing Market Trends
RJ0400011_19
- Last Update 12/21/2025
- File Size 0.3MB
- # of Slides 2
- File Format PPTX
- Slide Ratio 16:9
- Color
Keywords
About the Product
This slide utilizes a broken line graph to clearly visualize competitor analysis. The predominant colors of white and dark blue convey a clean and professional image, with various elements meticulously arranged to emphasize data trends. This slide is perfect for understanding and analyzing market shifts and competitive dynamics, making it highly useful for presentations by executives or marketing teams. Specifically designed for presentations focused on market trend analysis, it offers a straightforward editing process with 'easy' difficulty for replacing text and graphs.
Related Products
-

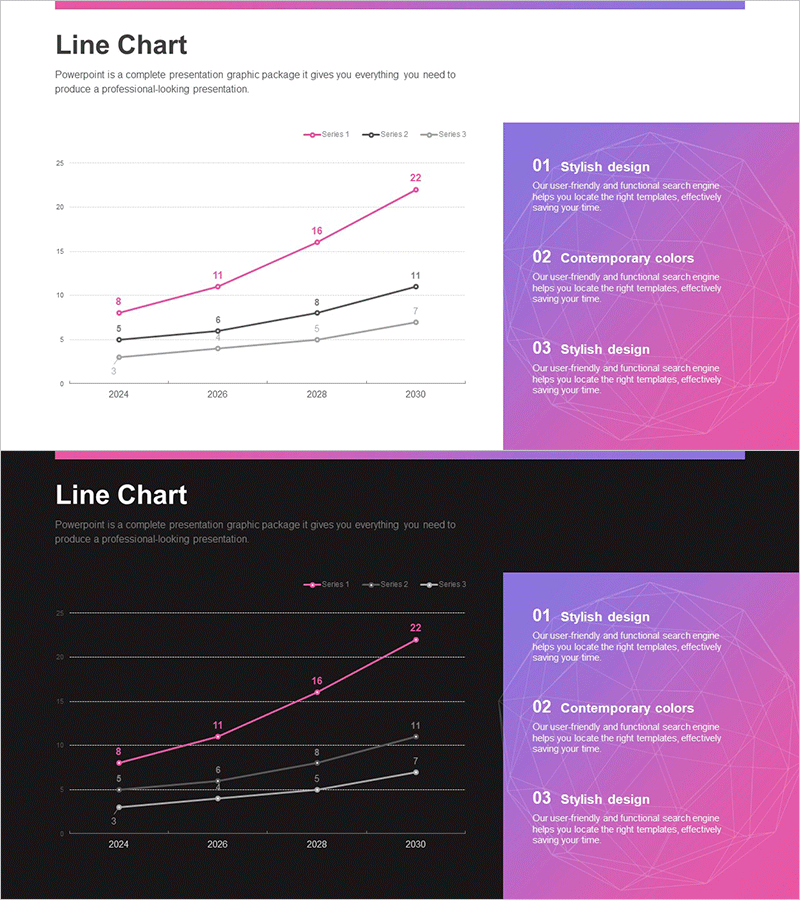
Premium Design Infographic – Top Quality
#Product/Service #Graph #Features
-
White Black Broken Line Graph – Best for Market Analysis
#Market and Competitor Analysis #Graph #Competitor Analysis
-
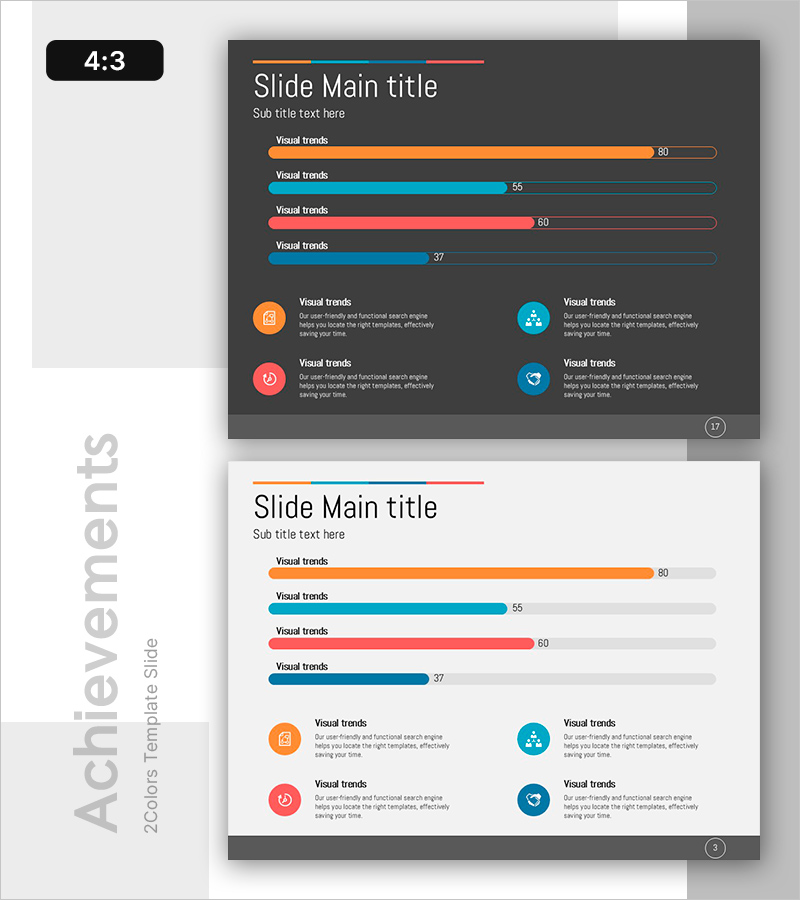
Business Data Overview Slide - Performance Visualization
#Company Introduction #Business Promotion Strategy #Graph
-
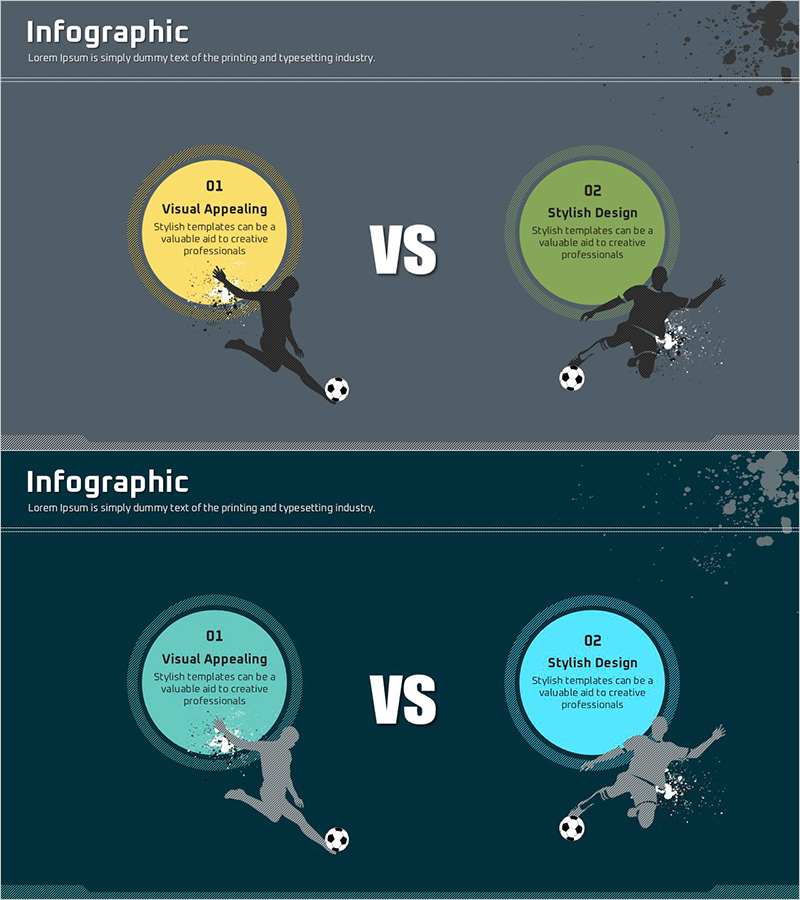
Soccer Match Silhouette – Market Analysis and Competitive Advantage
#Operation Plan #Market and Competitor Analysis #Text Box
