Market and Competitor Analysis
Market Analysis and Competitive Advantage Graph – The Power of Data Visualization
RJ0400010_15
- Last Update 12/21/2025
- File Size 0.2MB
- # of Slides 2
- File Format PPTX
- Slide Ratio 16:9
- Color
Keywords
About the Product
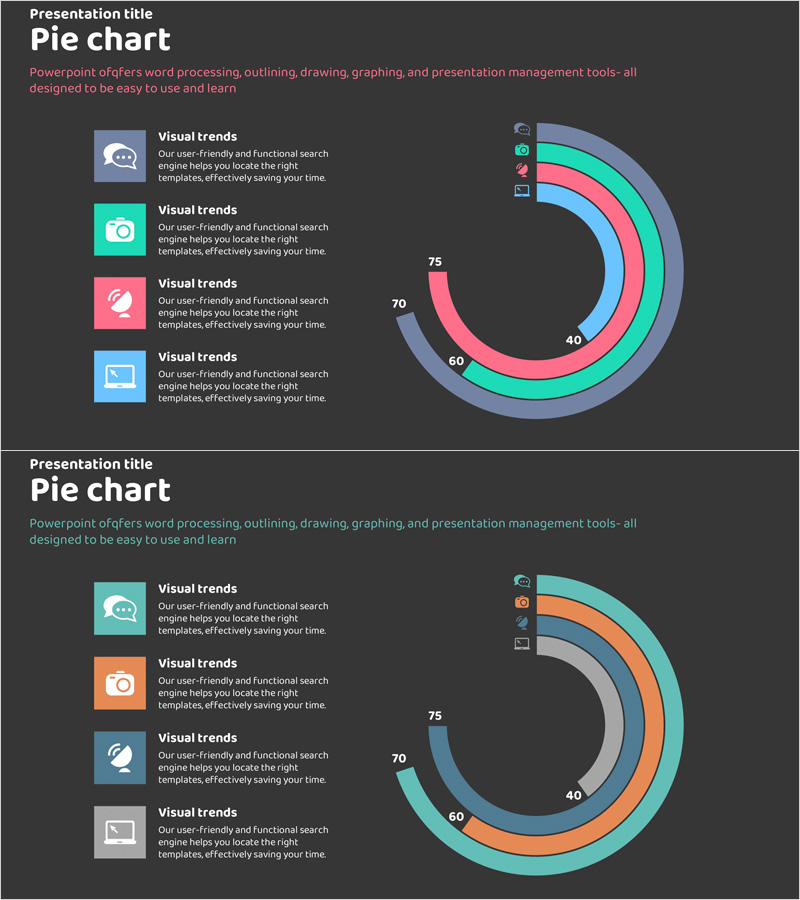
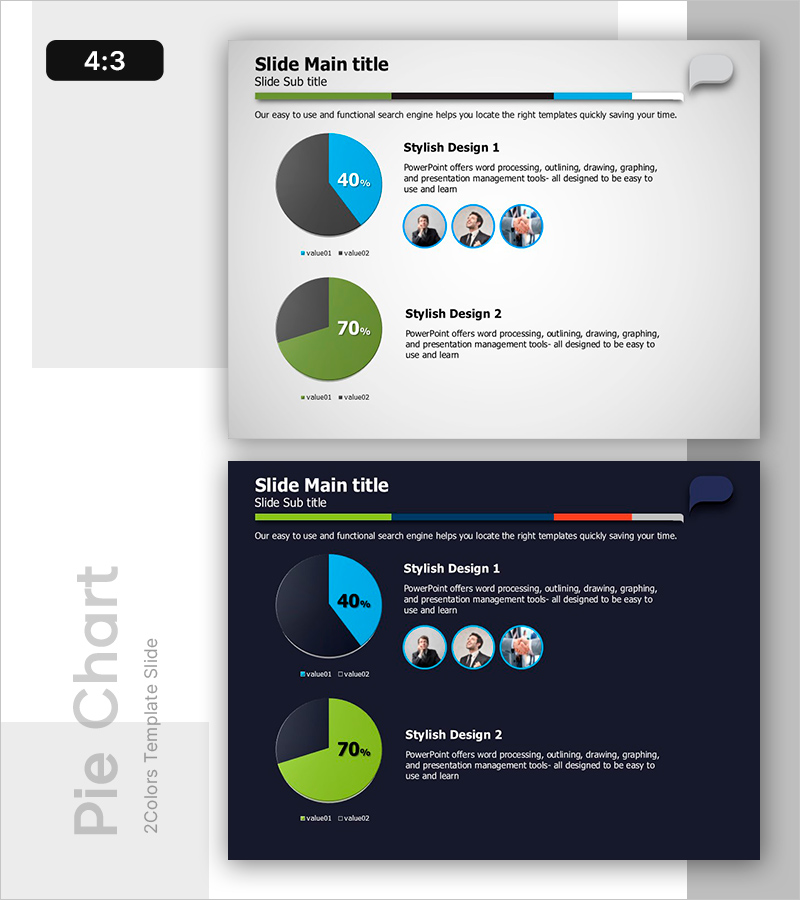
This slide features a pie chart designed to strengthen market analysis and competitive advantage. The simple and visually appealing design helps users intuitively grasp the flow of data. Utilizing vibrant red and turquoise colors encourages an emotional response and emphasizes the importance of the analyzed data. It is ideal for business reports, proposals, and presentations, with an editing difficulty rated as 'easy', allowing for quick application to various contents.
Related Products
-
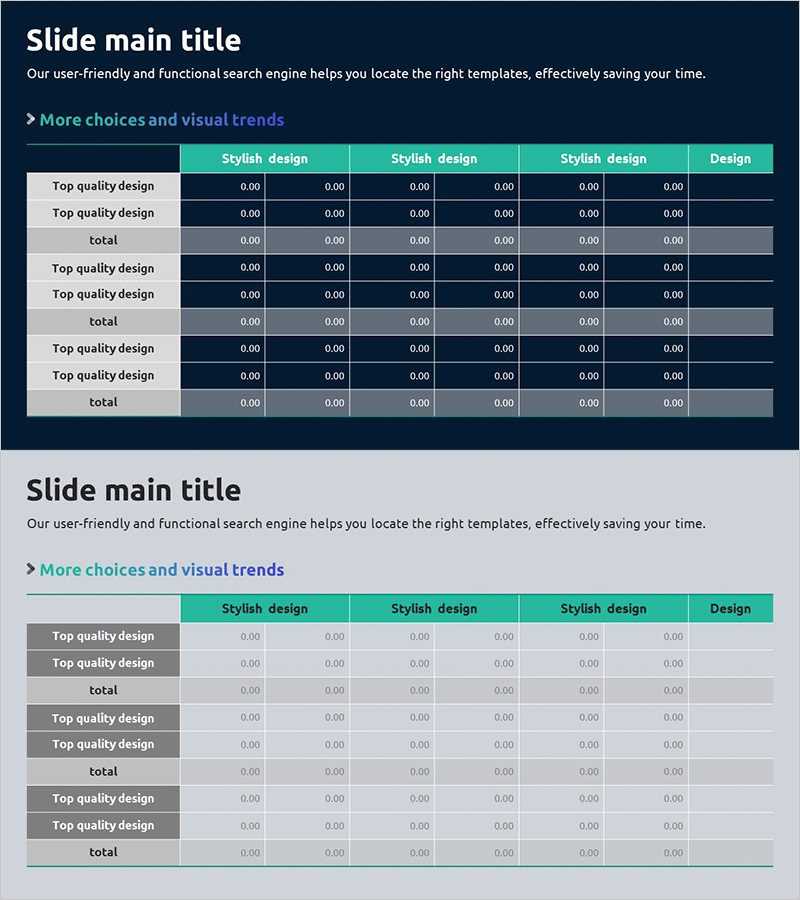
Market Analysis Table Chart – Practical Data Visualization
#Market and Competitor Analysis #Diagram #Market Analysis
-
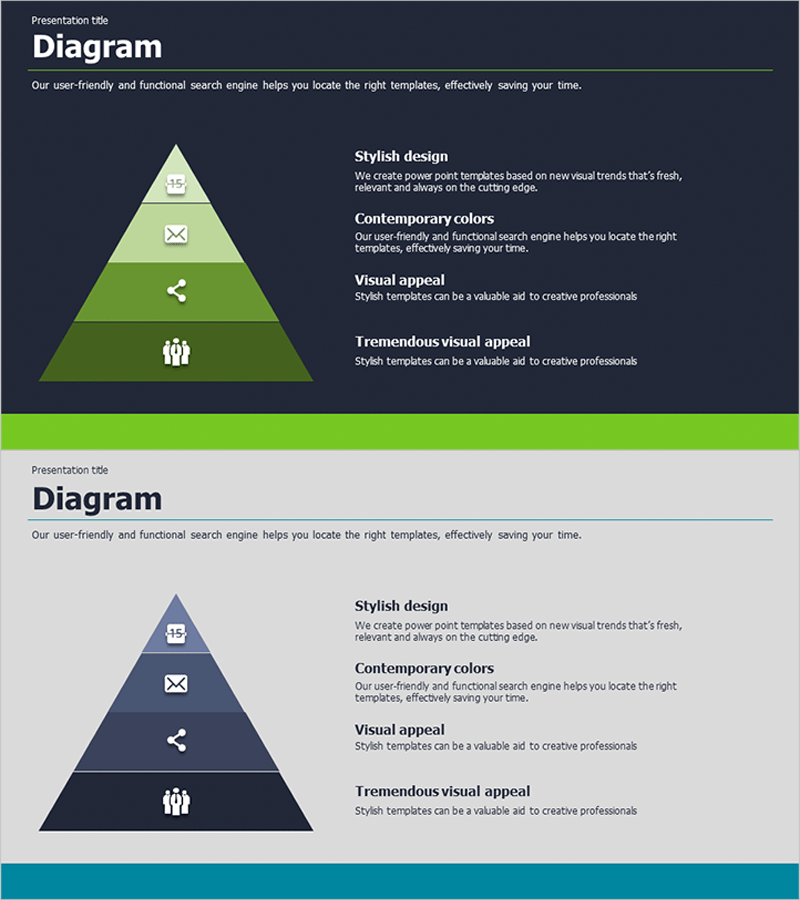
Market Analysis PowerPoint Template Using Pyramid Diagram
#Market and Competitor Analysis #Marketing Plan and Strategy #Diagram
-
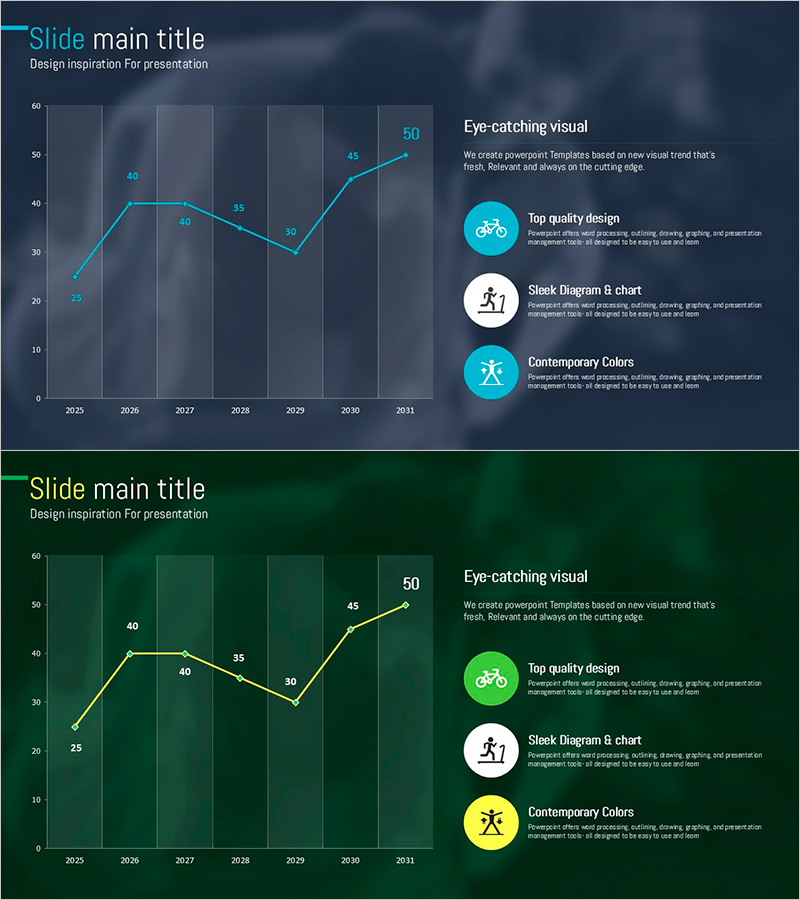
Blue Green Break Line Chart Analysis – Business Strategy and Market Analysis
#Business Promotion Strategy #Market and Competitor Analysis #Graph
-
Two Pie Charts with Commentary – Market Share Analysis
#Market and Competitor Analysis #Graph #Market Status
