Market and Competitor Analysis
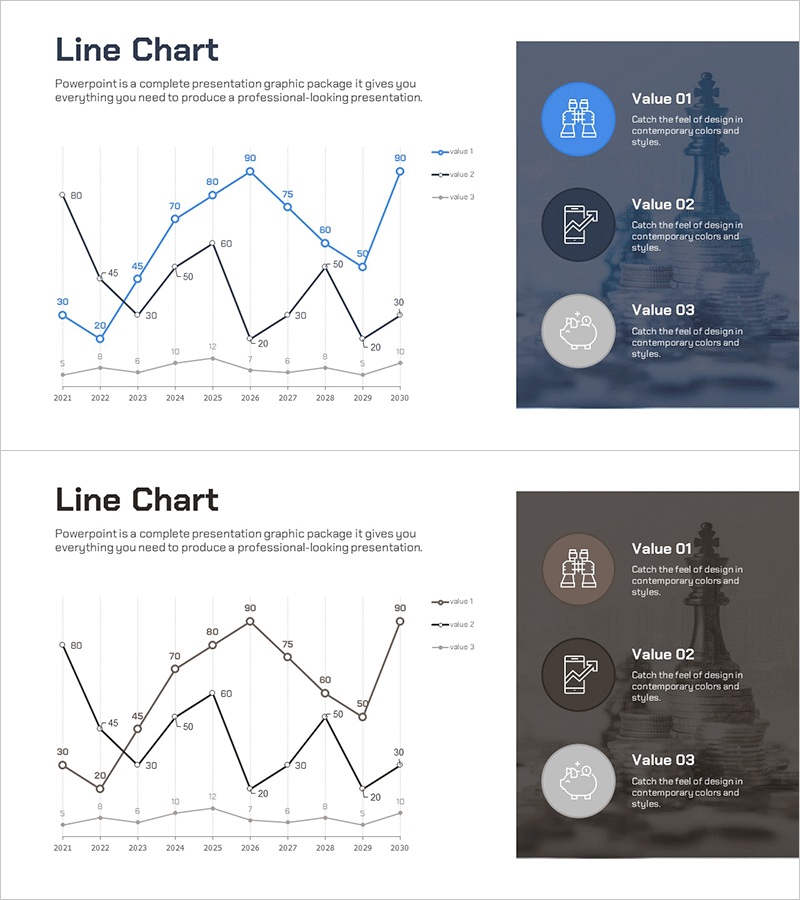
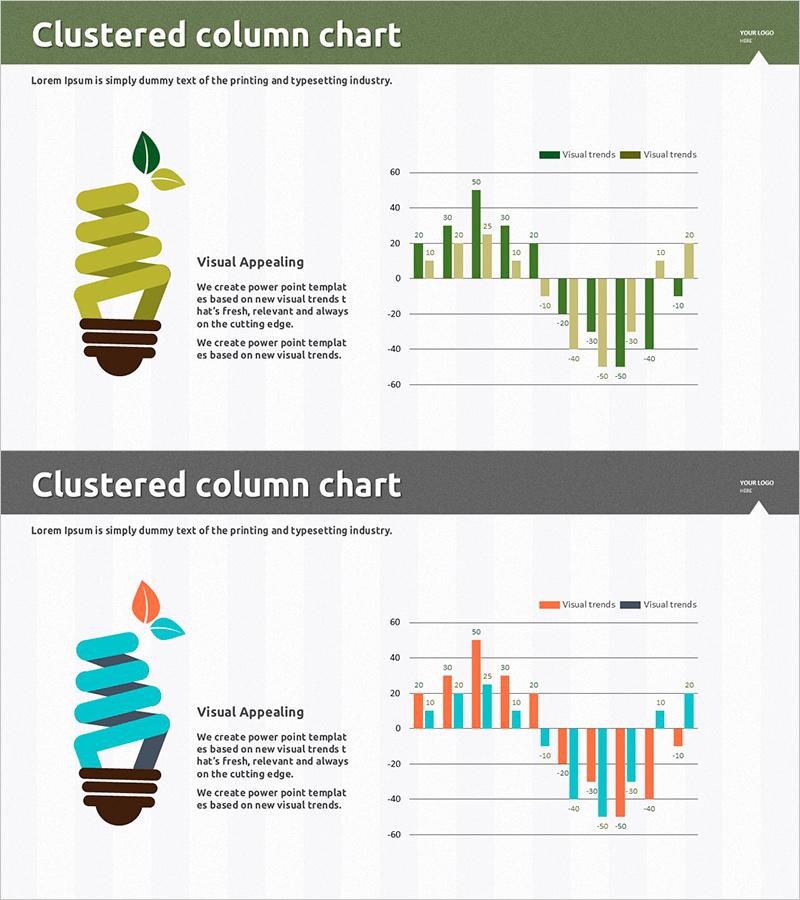
Annual Investment Analysis Graph – Competitor Analysis and Cluster Visualization
RJ0300095_22
- Last Update 12/21/2025
- File Size 1.1MB
- # of Slides 2
- File Format PPTX
- Slide Ratio 16:9
- Color
Keywords
About the Product
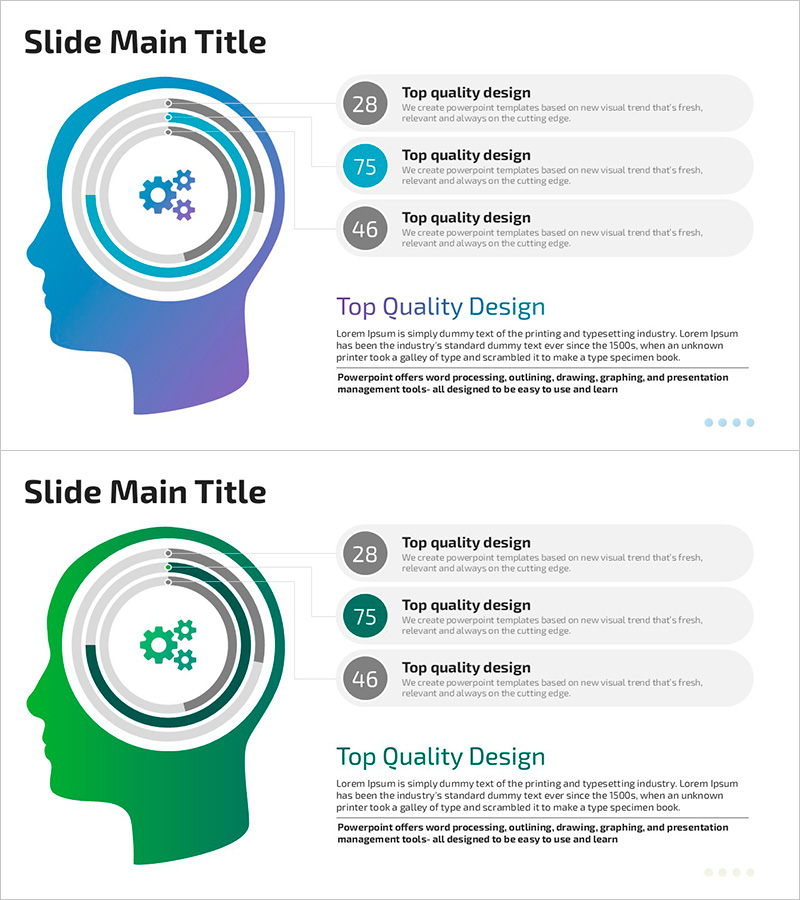
This slide utilizes the Ringer Shape Subdivided Column Graph for annual business investment analysis, clearly demonstrating comparative analysis. With a closed cluster design for trend and competitor analysis, it is highly suitable for market analysis reports. The harmonious blue and brown tones provide a professional feel, enabling effective information delivery. It is ideal for use in market and competitor analysis reports, combining practicality with professionalism.
Related Products
-
Circular Gradient Wide Template Diagram2
#Business Management #Technology Sector #Diagram
-
Renewable Energy Market Analysis Horizontal Bar Chart – Successful Strategies for Carbon Neutrality
#Market and Competitor Analysis #Financial Plans and Performance #Corporate Social Responsibility
-
Space Rocket Roadmap Slide – Business Strategy and Operation Plan
#Business Promotion Strategy #Operation Plan #Diagram
-
Artificial Intelligence Donut Chart Analysis – A New Standard in Data Visualization
#Technology Sector #Graph #Other
