Circular Gradient Wide Template Diagram2
RJ0200056_18
- Last Update 04/14/2025
- File Size 1.9MB
- # of Slides 2
- File Format PPTX
- Slide Ratio 16:9
- Color
Keywords
- #Content-Based Slides
- #Design-Based Slides
- #Business Management
- #Technical Approach
- #Diagram
- #Execution Plan
- #Future Development Roadmap
- #Flow
- #Linear Flow
- #16:9
- #directional arrow diagram PowerPoint
- #5-step process flow slide
- #gradient arrow diagram template
- #business process PowerPoint slide
- #how to create process flow in PowerPoint
About the Product
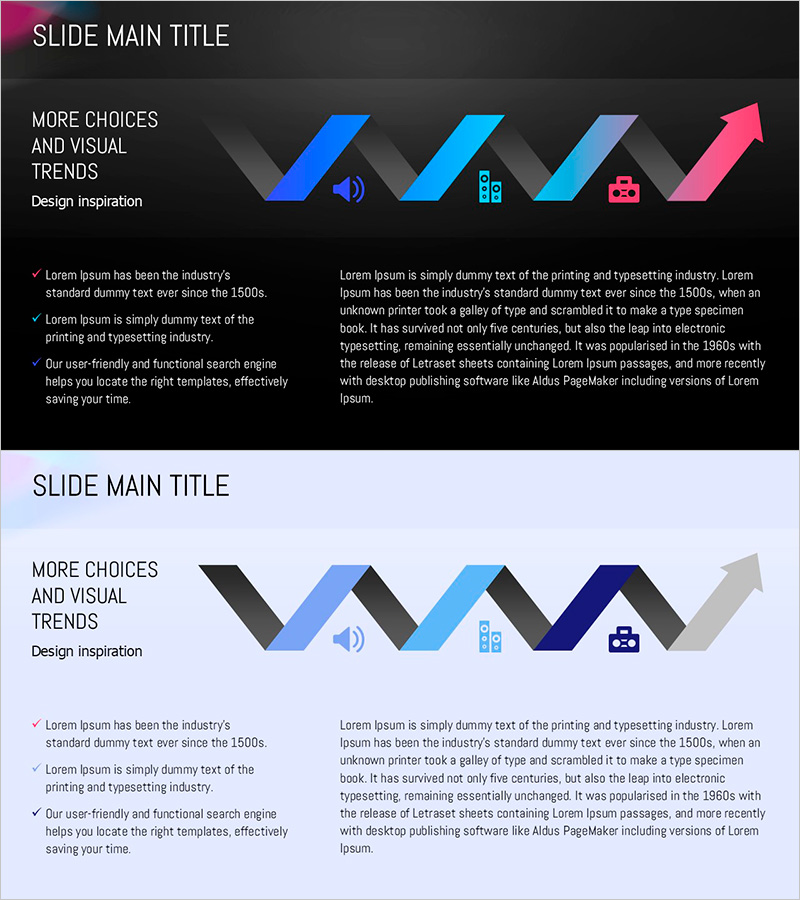
A directional arrow diagram PowerPoint slide featuring five sequential nodes with gradient color transitions from blue to pink. This presentation template uses high-contrast colors against a dark background to ensure visibility on large screens and projectors. Ideal for technology, business management, and strategic planning presentations, the slide deck provides immediate usability with flexible editing options. The 16:9 widescreen format includes two slides with dedicated text areas for detailed explanations alongside the process flow visualization.
Usage Points
-
Main Usage
Designed to visually represent sequential processes, workflows, and business progression through directional arrow nodes. The five-step structure effectively communicates technology roadmaps, project timelines, and business process improvements with clear directional flow.
-
How to Use
Input step names, descriptions, and metrics into each arrow node to complete the process visualization. The dark background with high-contrast colors ensures clarity on projectors and large displays. Use the dedicated text area to add detailed explanations for each stage of the process.
-
Recommended For
Recommended for technology engineers, project managers, business strategists, and marketing professionals presenting roadmaps, process improvements, and strategic initiatives. Suitable for investor presentations, internal reports, and client proposals requiring professional process visualization.
-
Slide Structure
Two-slide deck with five directional arrow nodes arranged horizontally in a left-to-right progression. Gradient colors transition from blue through cyan, lavender, to pink, creating visual momentum. Layout features a two-column design with text area on the left and diagram on the right for balanced information presentation.
Related Products
-

Structure and Characteristics of Plant Growth Stages – Technical Insight
#Technical Approach #Market and Competitor Analysis #Diagram
-

Strategic System Design for Goal Setting – Effective Operational Planning
#Operational Plan #Technical Approach #Diagram
-

Detailed Diagram for an Effective Strategy
#Business Vision and Strategy #Technical Approach #Diagram
-

Business Future Development Direction Diagram
#Business Strategy #Technical Approach #Diagram
