Financial Plans and Performance
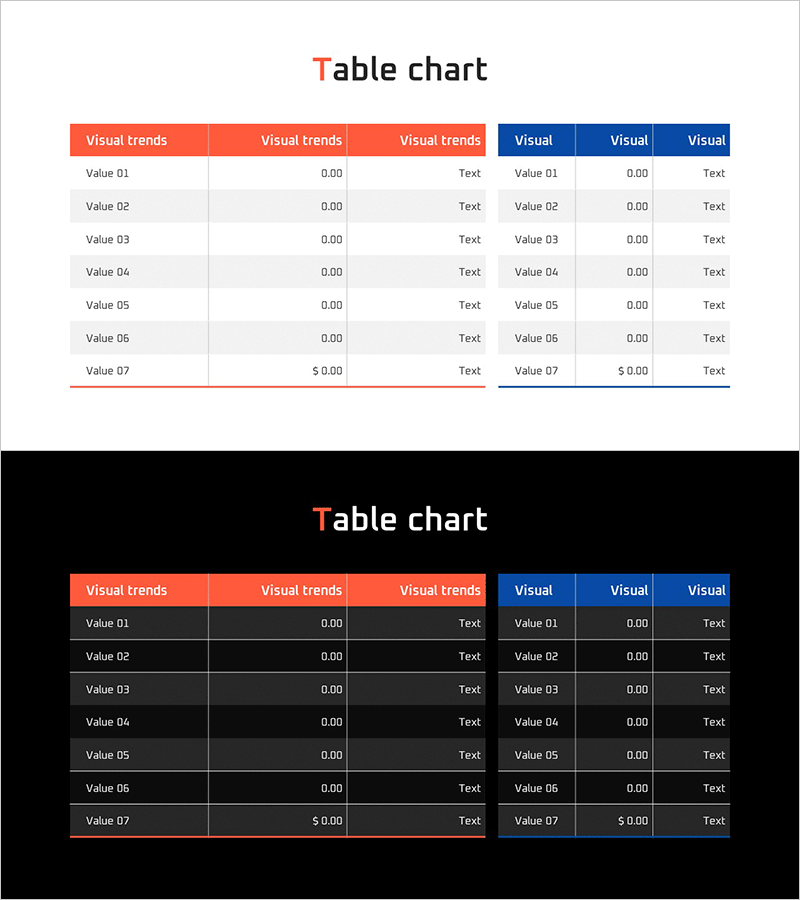
Blue Orange Table Chart for Visualizing Profit Structure – Suitable for Financial Planning
RJ0300090_22
- Last Update 12/21/2025
- File Size 0.3MB
- # of Slides 2
- File Format PPTX
- Slide Ratio 16:9
- Color
Keywords
About the Product
This slide utilizes a blue and orange color combination table chart to clearly visualize the profit structure. It features a well-structured layout for effectively conveying sales and income statement data. This slide showcases a clean design with a white background, effectively representing the theme of 'financial planning'. It allows for easy editing of text and figures, with an editing difficulty rated as 'easy'. It is a practical slide that can be immediately utilized by business practitioners or financial experts.
Related Products
-
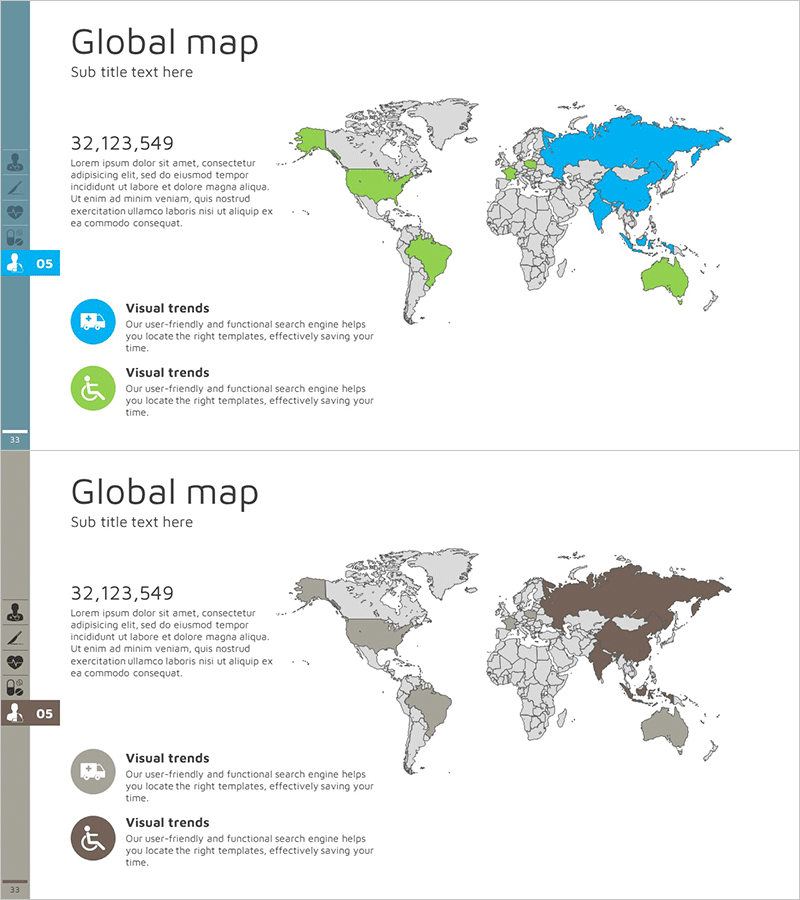
Global Target Market Strategy Map – Effective Entry Strategy
#Marketing Plan and Strategy #Diagram #Other
-

AI Service Area Diagram – Expressing Business Vision and Strategy
#Business Introduction #Business Vision and Strategy #Diagram
-
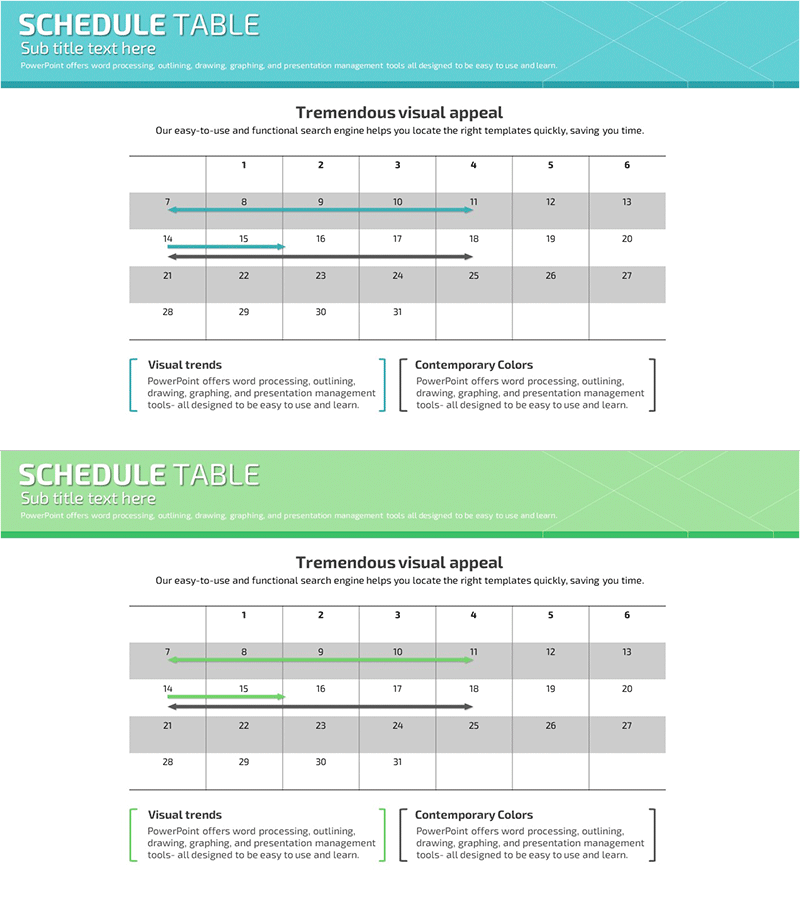
Simple Schedule Planner - Efficient Business Management
#Business Management #Operation Plan #Diagram
-
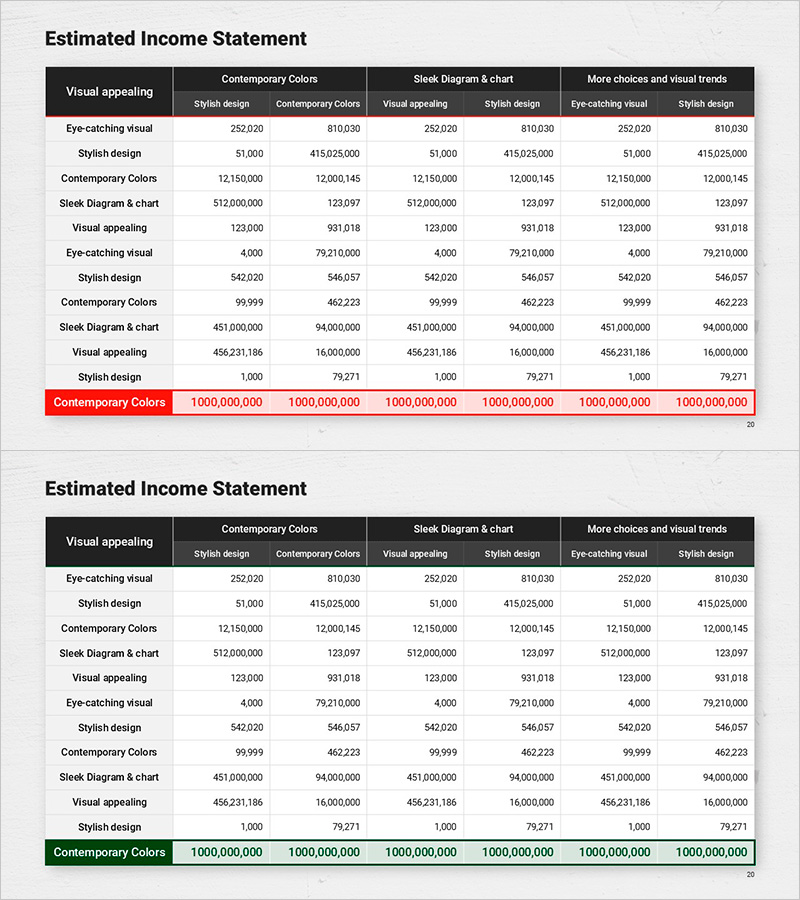
Cafe Business Projected Income Statement Slide
#Financial Plans and Performance #Diagram #Capital Requirement Plan
