AI Service Area Diagram – Expressing Business Vision and Strategy
RJ0700025_17
- Last Update 07/29/2025
- File Size 1.3MB
- # of Slides 2
- File Format PPTX
- Slide Ratio 16:9
- Color
Keywords
- #Content-Based Slides
- #Design-Based Slides
- #Business Introduction
- #Business Vision and Strategy
- #Diagram
- #Business Areas
- #Business Goals
- #Spread
- #Centralized Diagram
- #16:9
- #3-step cycle diagram PowerPoint
- #center icon circular slide
- #business process diagram PowerPoint template
- #AI service area diagram slide
- #strategy visualization presentation
About the Product
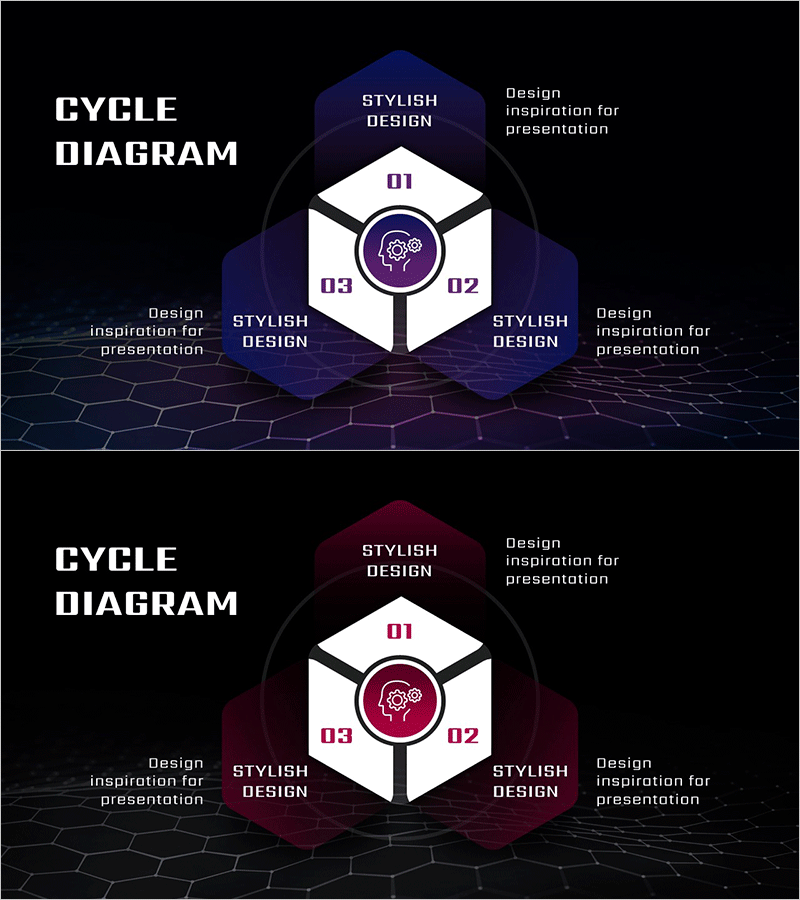
A 3-step cycle diagram PowerPoint slide designed to express AI service areas, business vision, and strategic planning. The diagram features a central icon surrounded by three diamond-shaped nodes connected in a clockwise circular flow, visually representing process cycles, sequential stages, and interconnected relationships. The navy and wine two-tone background with white diamonds and numbered labels creates clear information hierarchy, making it immediately applicable for technology-focused presentations and business model explanations. Provided in 16:9 widescreen format with 2 slides to accommodate various presentation scenarios.
Usage Points
-
Main Usage
Optimized for expressing AI service domains, business vision, strategic planning, and business model descriptions where cyclical processes and stage-by-stage relationships need clear visualization. The structure places a core concept at the center with three elements cycling around it, effectively illustrating interconnected business domains, technology stacks, and operational cycles.
-
How to Use
Enter stage names, domain titles, or process labels into each diamond node, and customize the center icon to match your topic. Use in investor presentations, strategy briefings, technology seminars, and business plan pitches to emphasize cyclical relationships between key concepts. Text and colors can be customized to align with organizational branding and presentation themes.
-
Recommended For
Recommended for startup founders, technology executives, business planning teams, marketing strategists, consultants, and educators explaining business models, technology architecture, operational processes, and strategic initiatives to audiences. Particularly effective for technology-driven companies in AI, fintech, and SaaS sectors during investor pitches and internal strategy meetings.
-
Slide Structure
Central circular icon (gears, brain, network, etc.) surrounded by three diamond-shaped text boxes positioned at top, right, and left. Each diamond displays numbered labels (01, 02, 03) and connects to the center icon via white lines, creating a clockwise circular flow. Includes one navy-toned slide and one wine-toned slide for color variation options.
Related Products
-

Business Goals and Areas Electronics Mockup – Vision and Strategy
#Business Introduction #Business Vision and Strategy #Diagram
-

Diffusion Diagram of Business Objectives by Sector
#Business Introduction #Business Vision and Strategy #Diagram
-

Energy Business Area – Business Introduction Diagram
#Company Introduction #Business Introduction #Diagram
-

Energy Business Sector Diagram Slide – Flow and Spread
#Company Introduction #Business Introduction #Diagram
