Market and Competitor Analysis
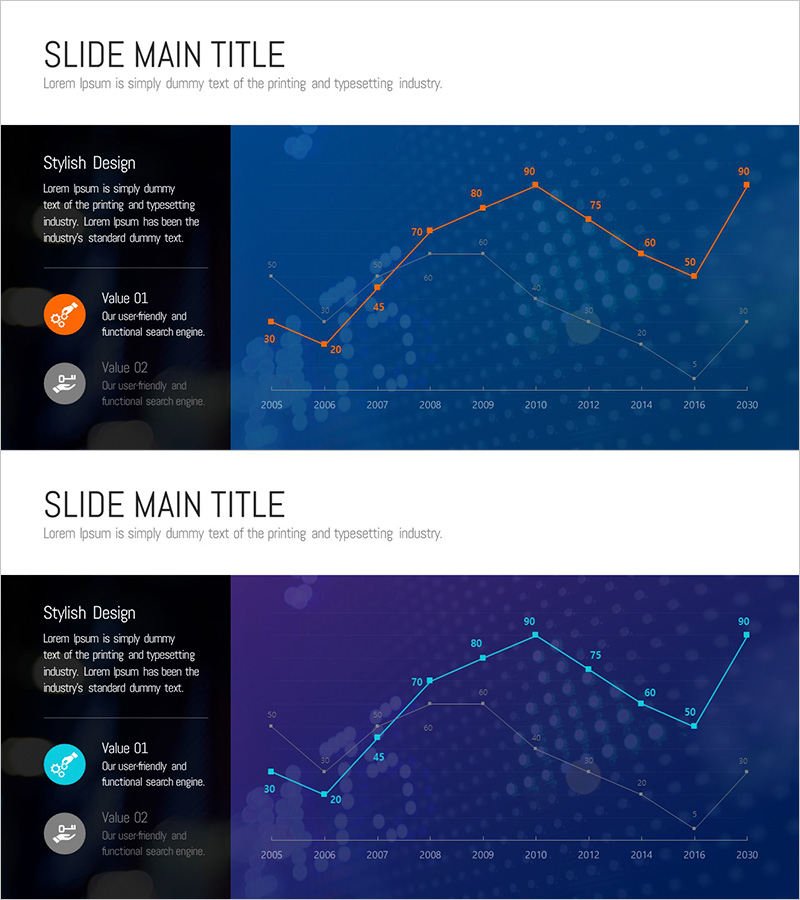
Comparative Analysis Line Graph – Highlighting Competitive Advantage
RJ0300083_8
- Last Update 12/21/2025
- File Size 2.6MB
- # of Slides 2
- File Format PPTX
- Slide Ratio 16:9
- Color
Keywords
About the Product
This slide utilizes a comparative analysis line graph to emphasize market trends and competitive advantage for competitor analysis. The elegant design using teal and red colors enhances visual appeal while offering a clear and concise layout for effective data presentation. Covering data from 2005 to 2030, it provides readers with a straightforward comparison. This slide is versatile, suitable for business presentations, investor reports, and market research documentation. The editing difficulty is rated as average, making it easy to swap text and graph elements.
Related Products
-

Renewable Energy Business Direction Green Mint
#Business Promotion Strategy #Technology Sector #Market and Competitor Analysis
-
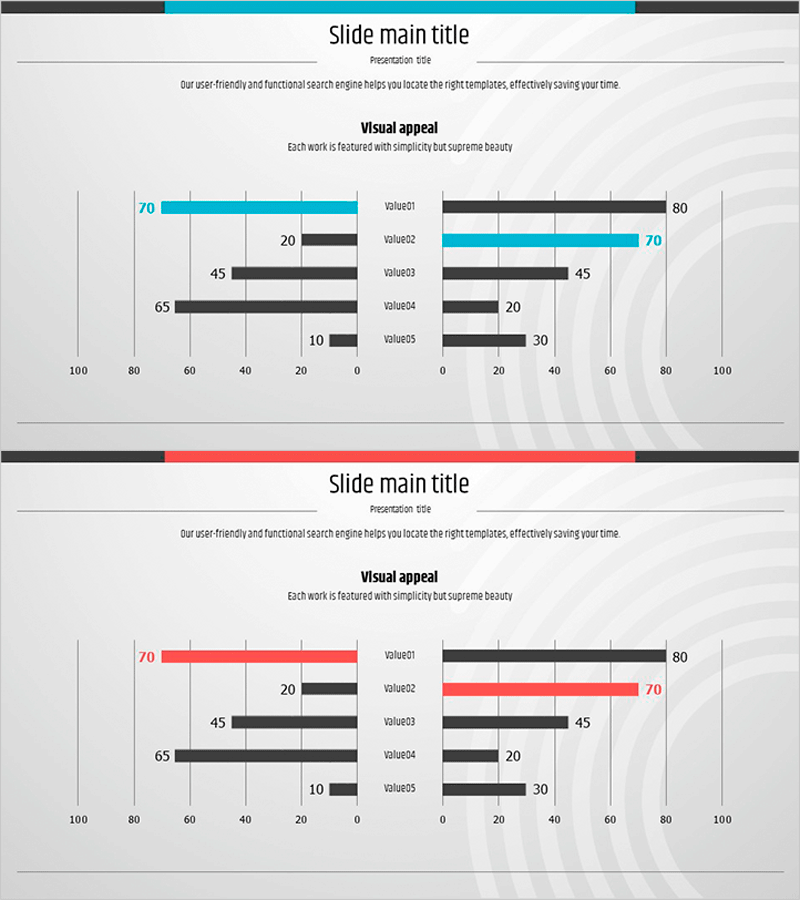
Identity Wide Template – Double Horizontal Bar Graph Usage
#Market and Competitor Analysis #Graph #Competitive Advantage
-
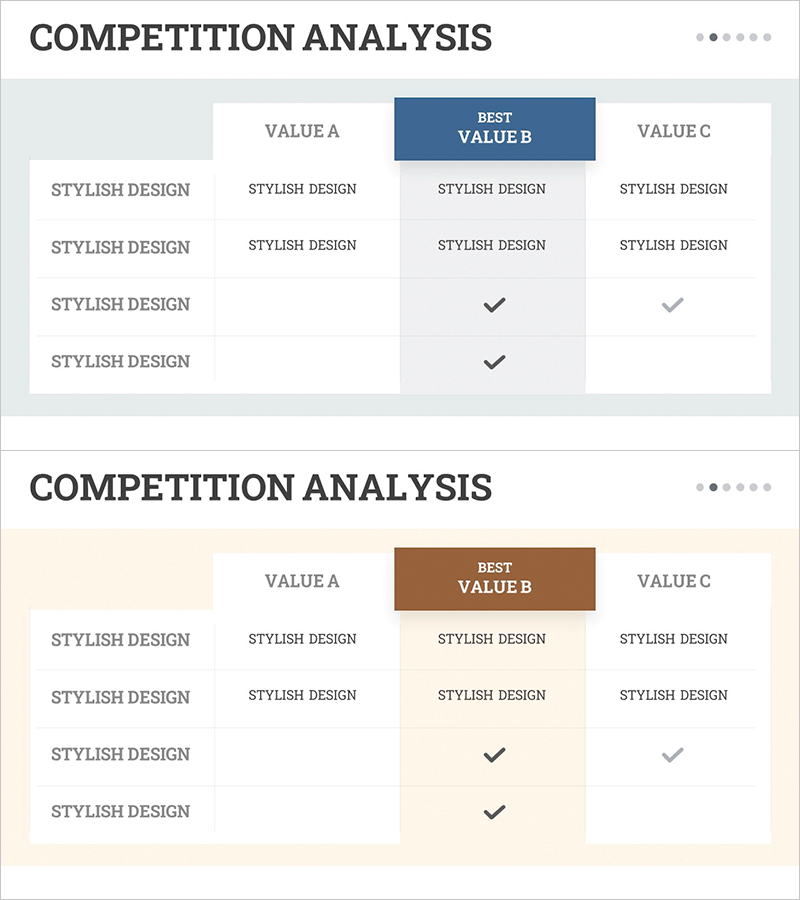
Competitor Analysis Checklist Table – Effective Market Analysis Tool
#Market and Competitor Analysis #Diagram #Competitor Analysis
-

Visualizing Subjects with Donut Charts – A Master of Information Delivery
#Product/Service #Business Introduction #Market and Competitor Analysis
