Market and Competitor Analysis
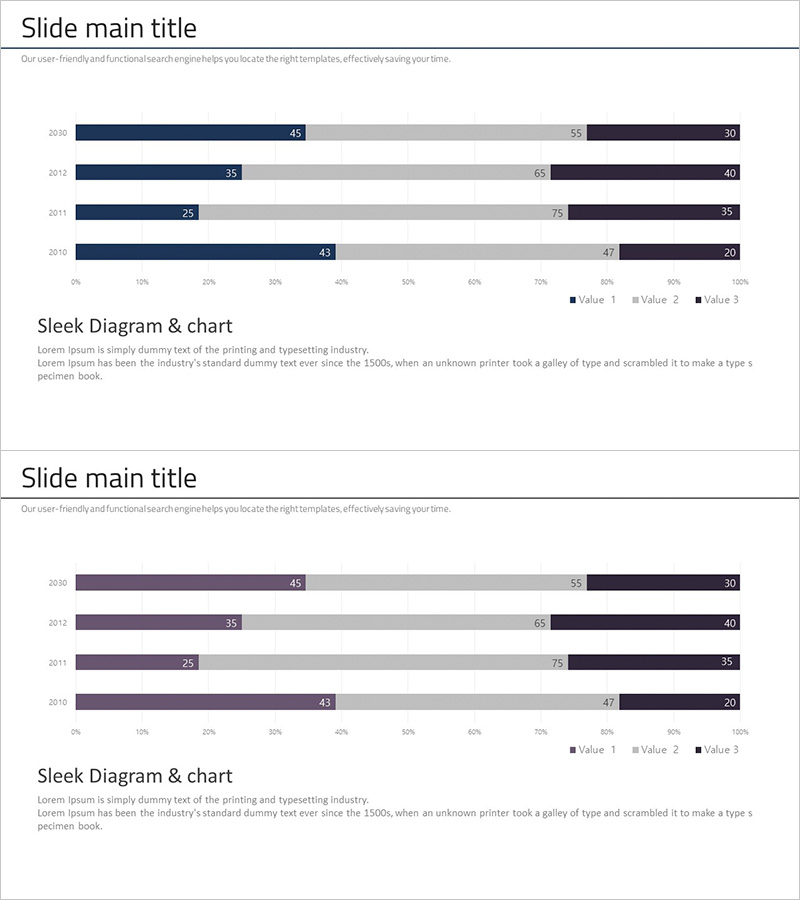
Crossbar Segmentation Analysis Graph – A Powerful Tool for Market Analysis
RJ0300077_25
- Last Update 12/21/2025
- File Size 1MB
- # of Slides 2
- File Format PPTX
- Slide Ratio 16:9
- Color
Keywords
About the Product
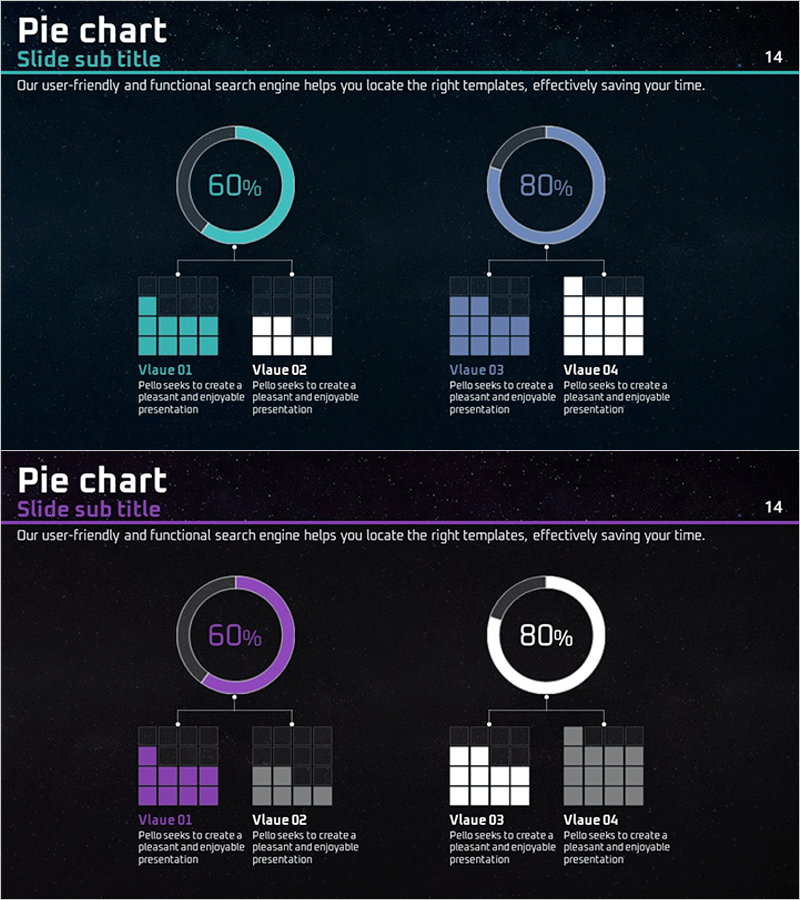
This slide utilizes a crossbar graph to aid in visualizing segmented analysis data. Designed with a clean and modern aesthetic, it maximizes information delivery. The harmonious color combination of navy, purple, and gray enhances stability and trust, with clear values displayed for effective comparisons. This slide is ideal for market and competitor analysis, systematically organizing the current state of business issues. The editing difficulty is moderate, allowing easy replacement of text and data.
Related Products
-
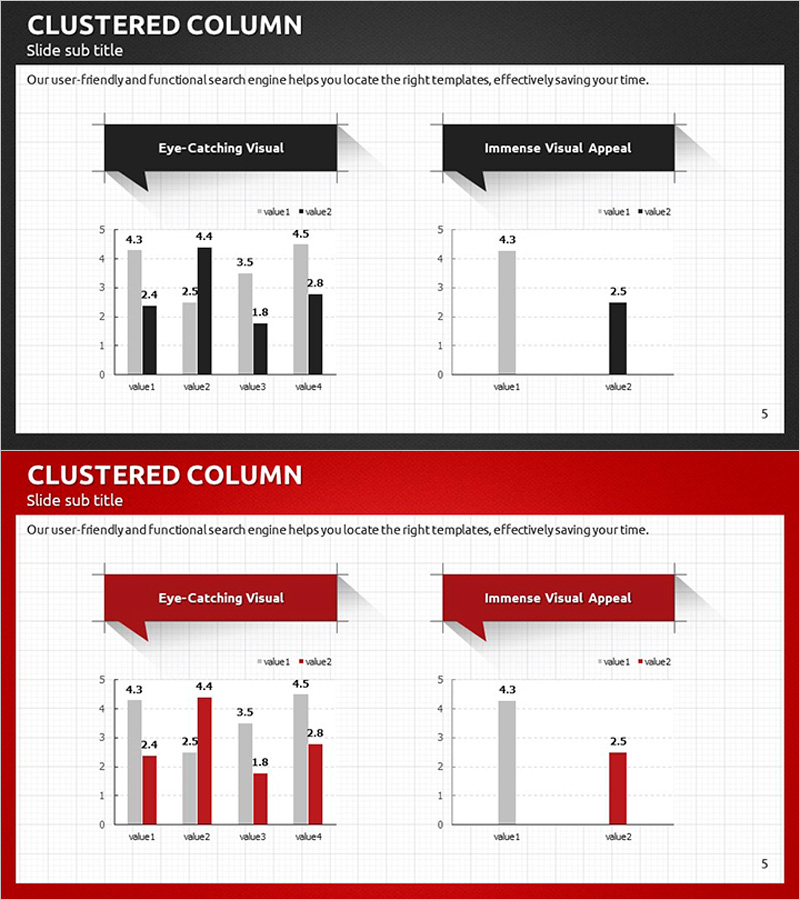
Modern Business Plan Template – Clustered Column Graph
#Market and Competitor Analysis #Graph #Market Analysis
-
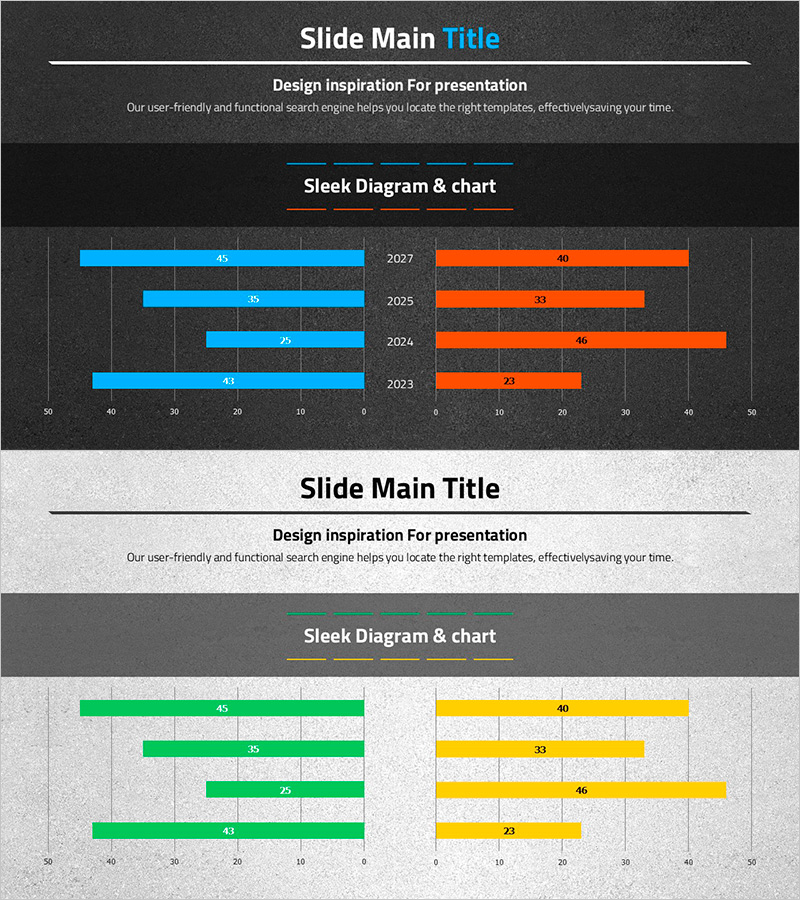
Car Wide Template Bilateral Bar Graph
#Market and Competitor Analysis #Graph #Competitor Analysis
-
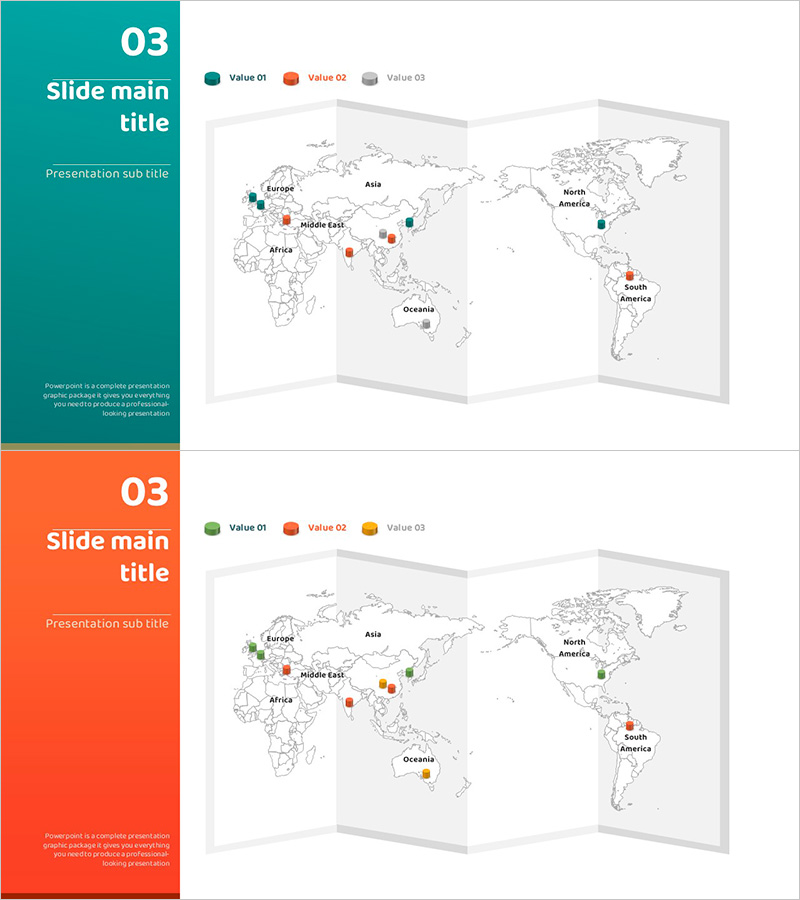
Global Map Camping Market Analysis by Country – Market Status and Opportunities
#Market and Competitor Analysis #Other #Market Analysis
-
Donut Circle Graph & Cube Graph – Optimized for Market & Competitor Analysis
#Market and Competitor Analysis #Graph #Other
