Market and Competitor Analysis
Competitor Analysis Bilinear Bar Graph – Visualizing Market Advantage
RJ0300075_15
- Last Update 12/21/2025
- File Size 1MB
- # of Slides 2
- File Format PPTX
- Slide Ratio 16:9
- Color
Keywords
About the Product
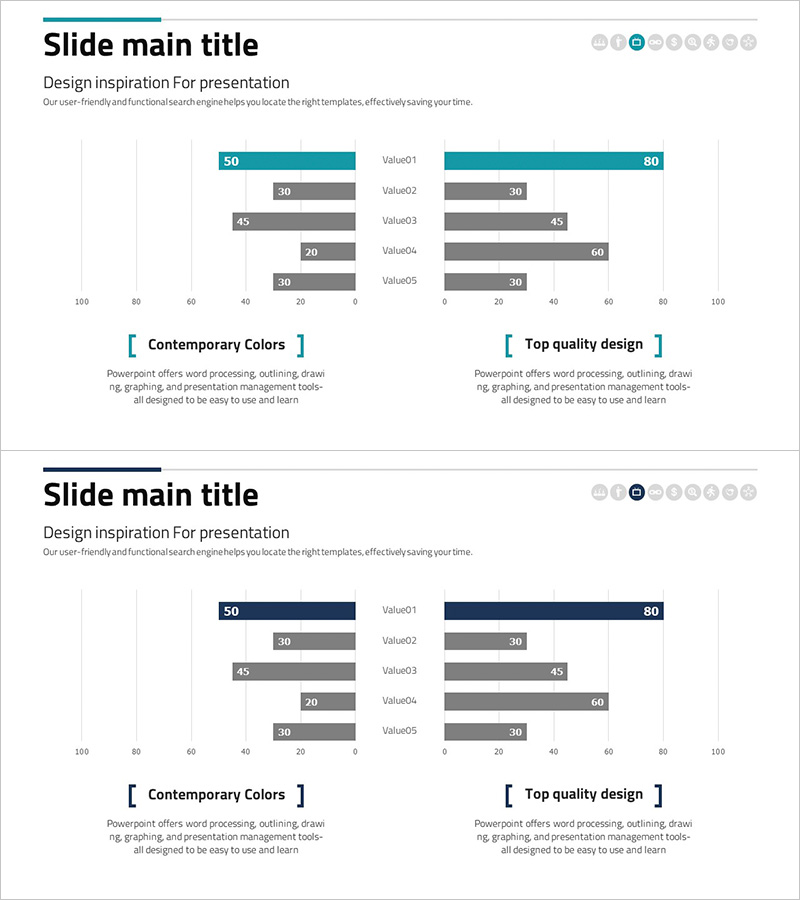
This slide utilizes a bilinear bar graph to effectively visualize competitor analysis, allowing for comparison of two sets of data. The harmonious combination of turquoise and navy conveys a modern and sophisticated feel, featuring a simple and clear layout. It helps users identify their competitive advantage in the market. Ideal for business strategy meetings, market analysis reports, and investment presentations, the editing difficulty is moderate, making data and text replacements straightforward.
Related Products
-
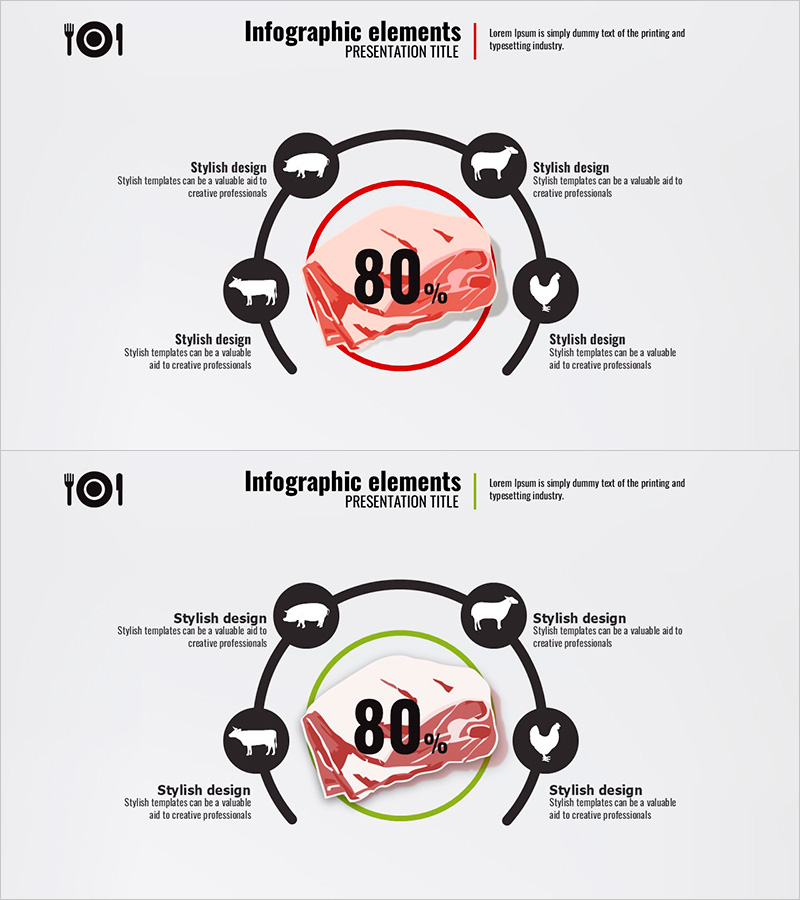
Meat Diffusion Diagram - Market Share and Status Analysis
#Market and Competitor Analysis #Diagram #Market Status
-
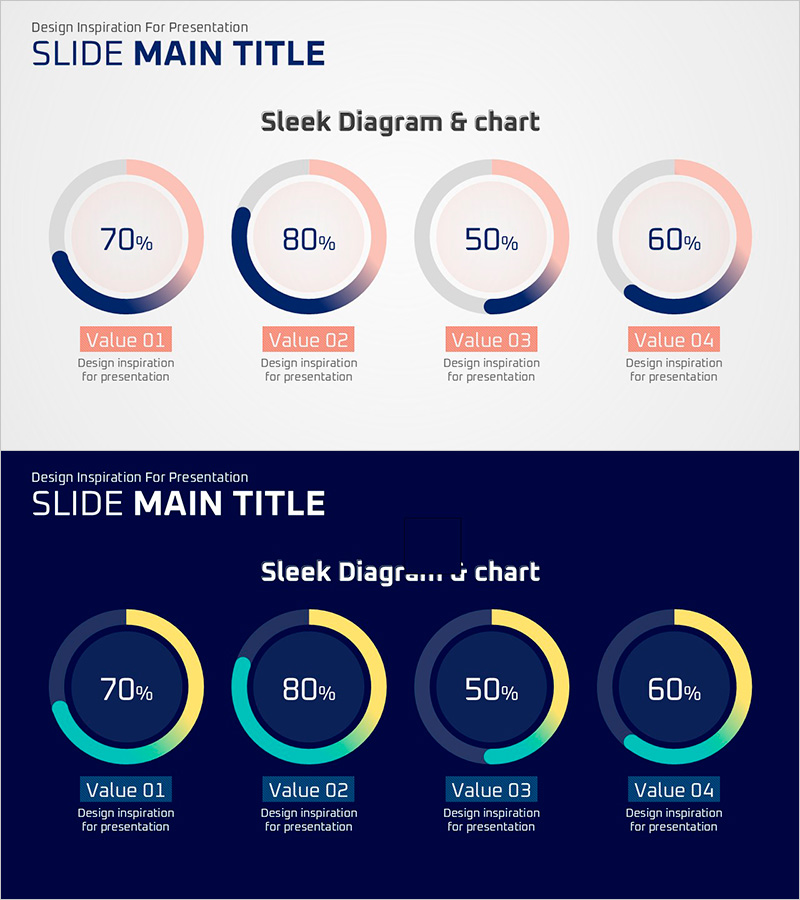
Progress Doughnut Graphs for Visualizing Key Achievements – Essential for Project Management
#Company Introduction #Product/Service #Diagram
-
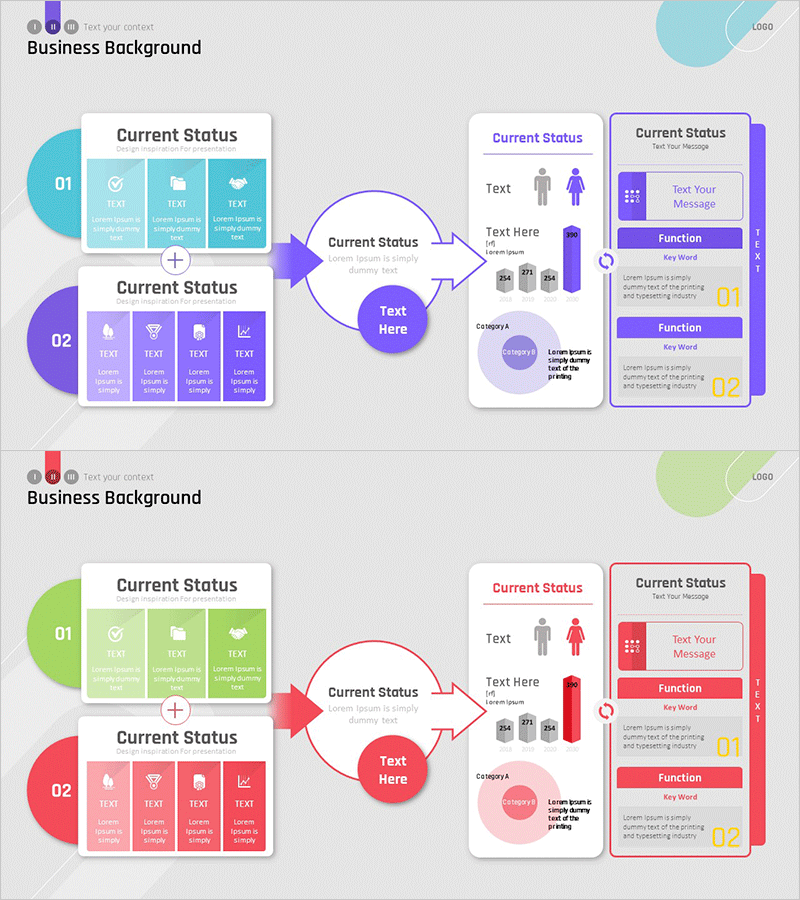
Introduction to Business Background Structure – Business Vision and Trends
#Company Introduction #Technology Sector #Diagram
-
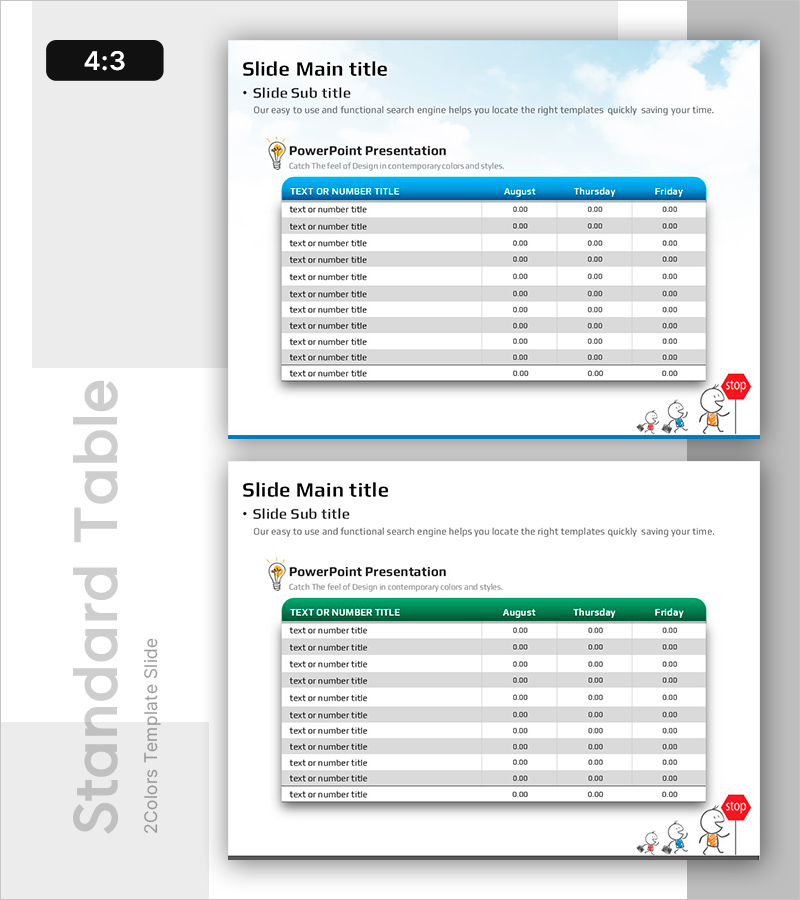
Table Template for Data Summary – Efficient Planning
#Market and Competitor Analysis #Diagram #Market Status
