Meat Diffusion Diagram - Market Share and Status Analysis
RJ0600041_18
- Last Update 07/01/2025
- File Size 0.7MB
- # of Slides 2
- File Format PPTX
- Slide Ratio 16:9
- Color
Keywords
- #Content-Based Slides
- #Design-Based Slides
- #Market and Competitor Analysis
- #Diagram
- #Market Status
- #Market Share
- #Spread
- #Radial Diagram
- #16:9
- #radial diagram PowerPoint
- #diffusion diagram slide template
- #market share analysis PPT
- #competitive landscape presentation
- #meat industry market analysis slide
About the Product
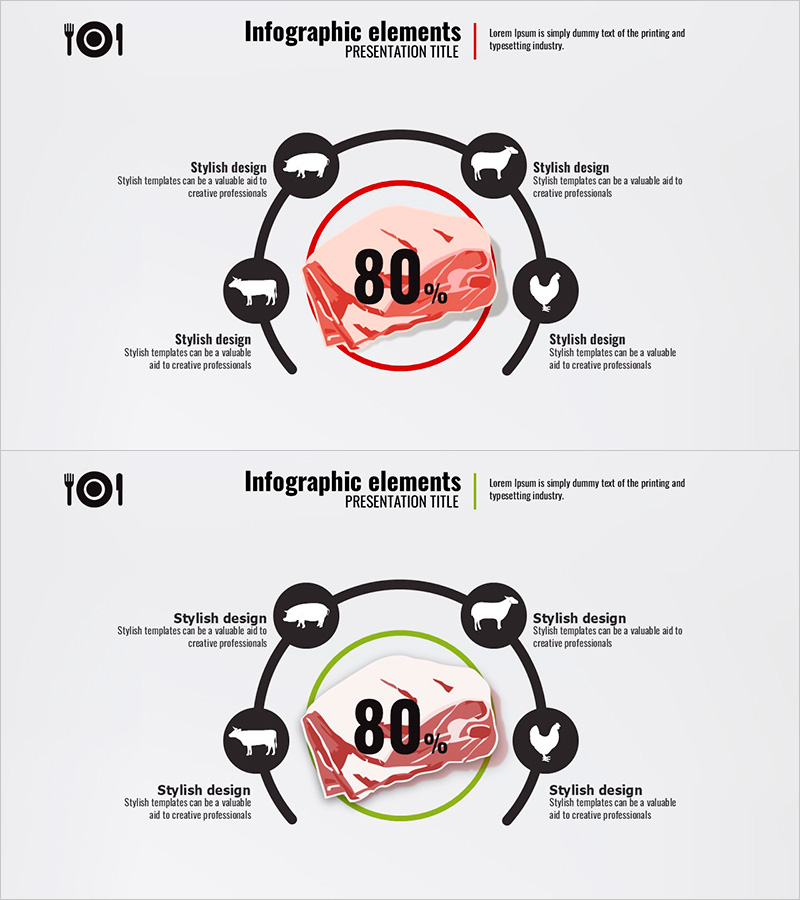
A radial diffusion diagram PowerPoint slide that visualizes market structure expanding from center to periphery. This presentation template segments the meat industry market share and competitive landscape into five nodes: beef, pork, chicken, lamb, and others. Black circular icons and red or green accent lines represent each category's market proportion, while an 80% metric in the central pie chart conveys overall market dominance. The 16:9 format includes 2 slides ready for business reports, market analysis sections, and competitive positioning presentations.
Usage Points
-
Main Usage
Illustrate meat industry market share, competitive comparison, and category-level market positioning through a center-to-periphery radial structure. The central pie chart emphasizes the key metric (80%), while five peripheral nodes simultaneously present detailed category breakdowns.
-
How to Use
Insert into market analysis sections of business reports, competitive landscape slides in marketing plans, and industry overview presentations for investor meetings. Customize node text and metrics to apply the template to other industries such as food & beverage, retail, or manufacturing.
-
Recommended For
Food and beverage marketing professionals, market research analysts, business planning teams, investor relations (IR) specialists, and industry report writers who need to clearly communicate competitive dynamics and market segmentation.
-
Slide Structure
Central pie chart with 80% metric and red accent line; five black circular icon nodes positioned at top, bottom, left, right, and center-right; descriptive text labels adjacent to each node. Two-slide set with first slide featuring red accent line and second slide featuring green accent line for comparative analysis.
Related Products
-

Food Nutrient Diagram – Market Share and Status Analysis
#Market and Competitor Analysis #Graph #Market Status
-

Breakdown of Industry Market Share – Insights through Data Visualization
#Market and Competitor Analysis #Graph #Market Status
-

3D Pie Chart Analysis (Green & Blue) – Market Share Visualization
#Market and Competitor Analysis #Graph #Market Status
-

Doughnut Chart for Office Worker Commuting Survey Results – Market Trends Visualization
#Market and Competitor Analysis #Graph #Market Status
