Product/Service
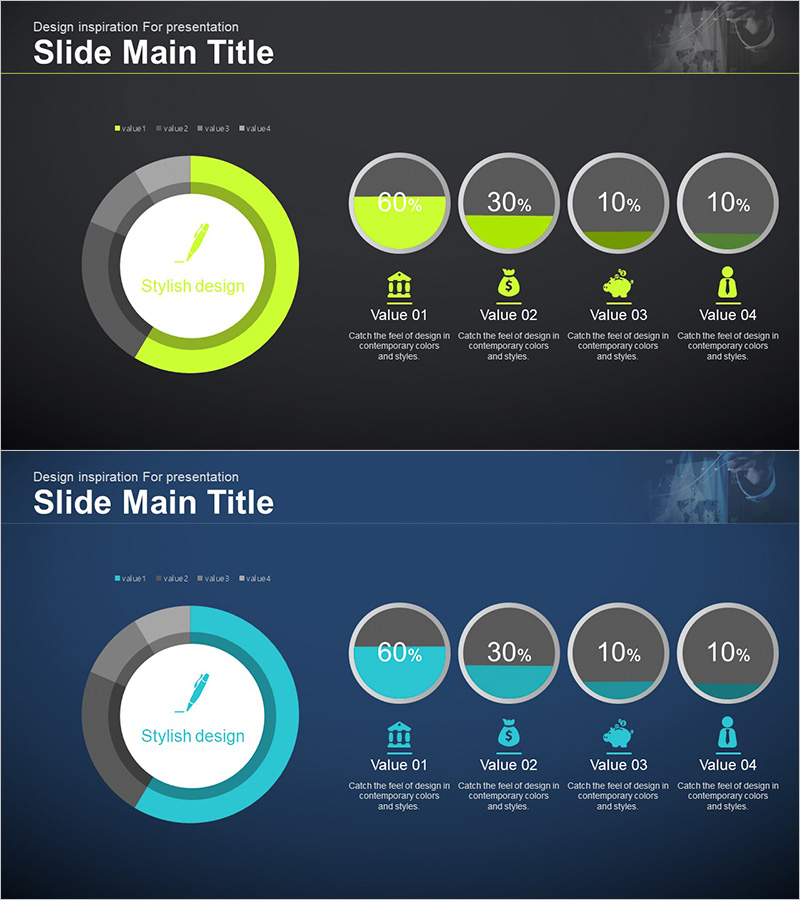
Financial Management Analysis Status Graph
RJ0300073_18
- Last Update 12/21/2025
- File Size 1.3MB
- # of Slides 2
- File Format PPTX
- Slide Ratio 16:9
- Color
Keywords
About the Product
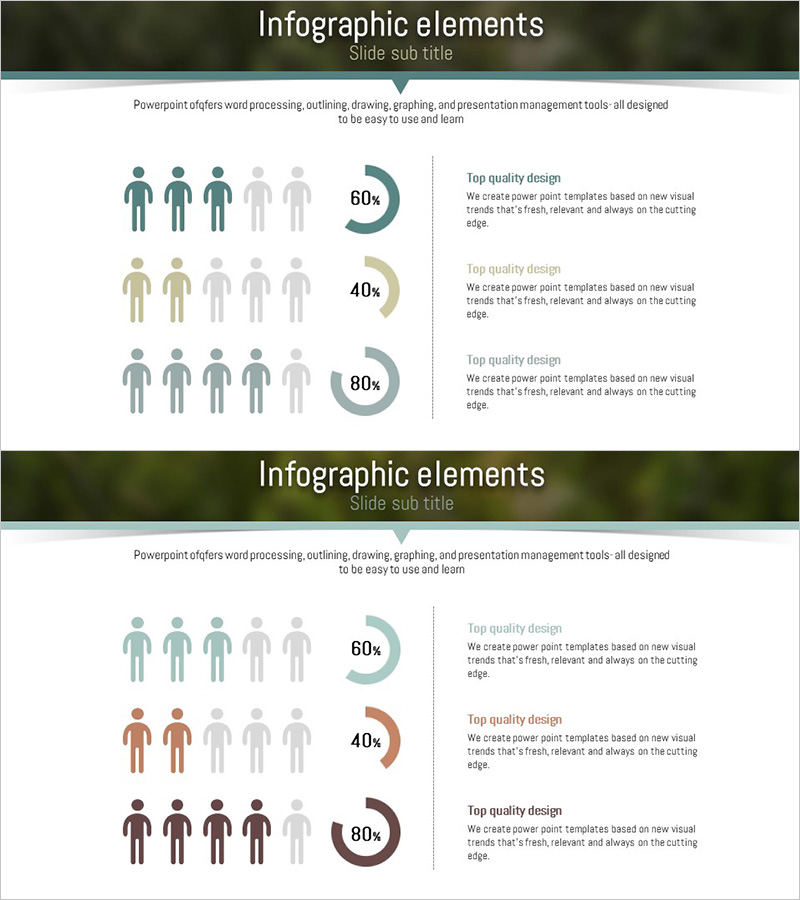
This slide features a donut chart that visually represents the status of financial management analysis. The contrasting combination of orange and black colors stands out, creating a modern and stylish aesthetic. This slide is suitable for business and product/service introductions, allowing for easily conveyance of essential data indicators. Text and data fields are easy to replace, with an overall editing difficulty rated as 'easy', enabling quick integration into various presentations.
Related Products
-
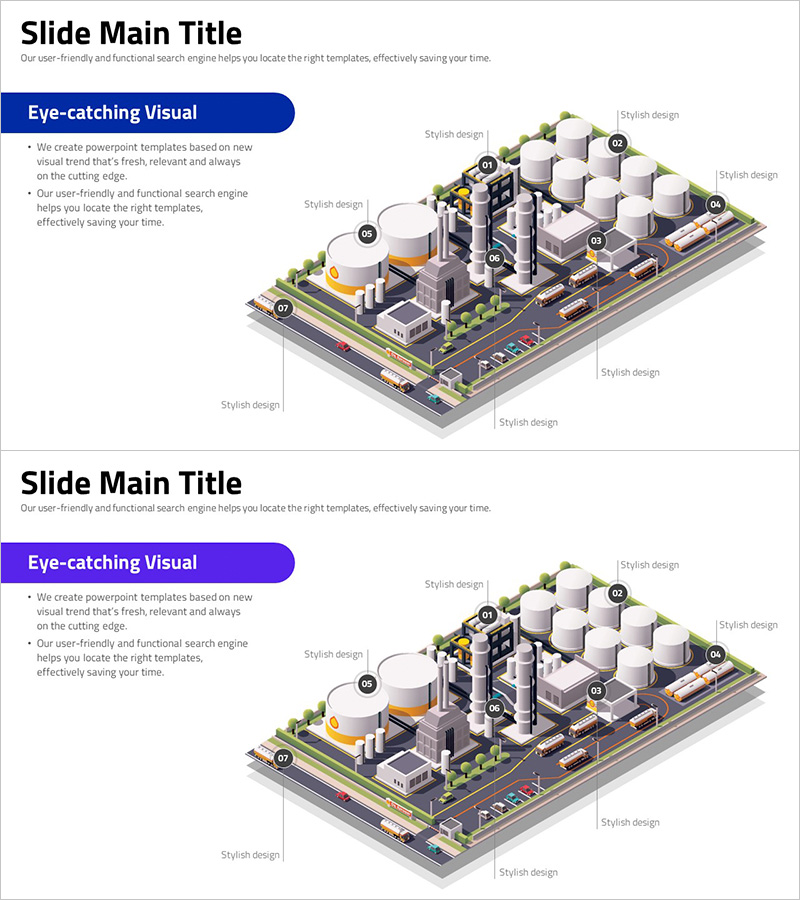
Infographic Slide for Visualizing Key Industrial Facilities
#Product/Service #Technology Sector #Composition
-
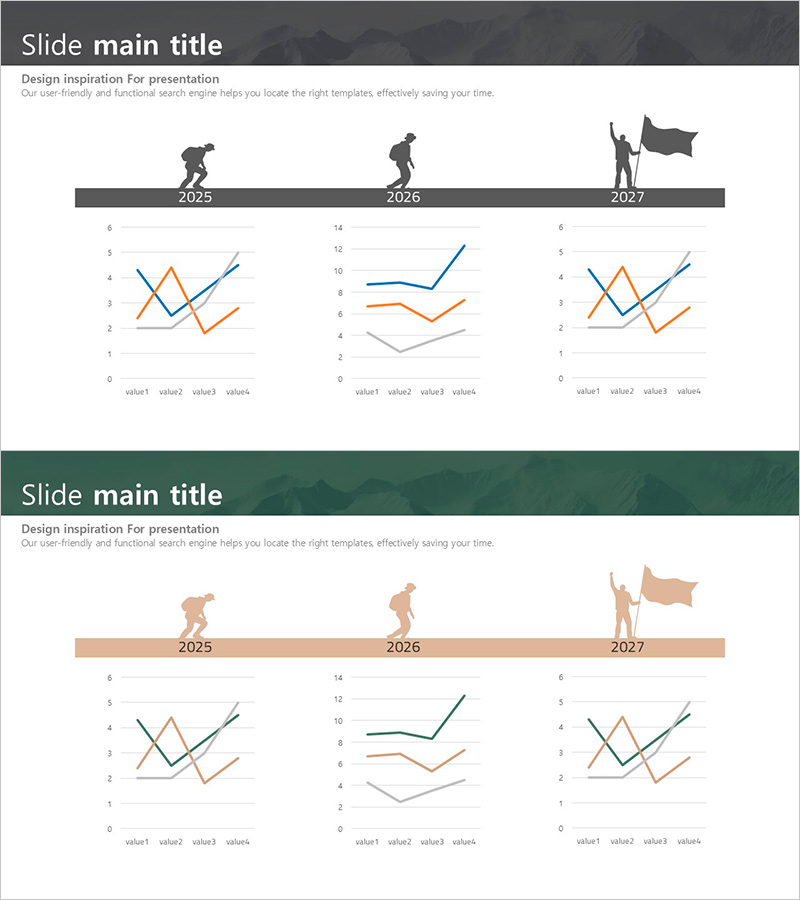
Climbing Silhouette Bent Line Graph – Market Analysis and Performance
#Business Promotion Strategy #Market and Competitor Analysis #Graph
-
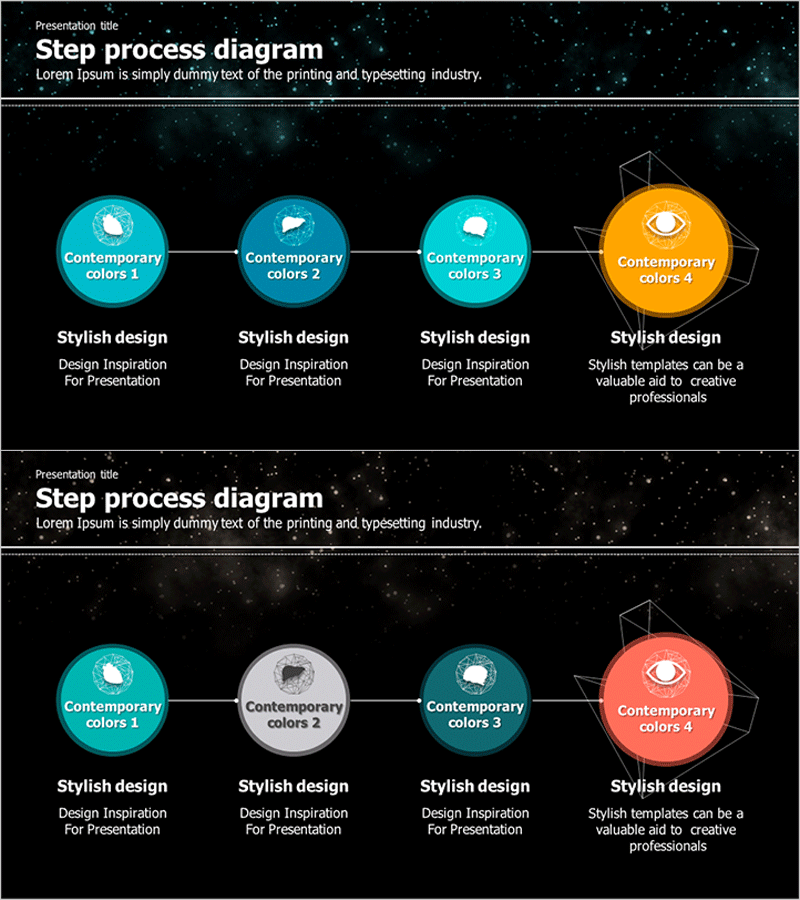
Galaxy Theme Attribute Connection Diagram – Engaging Business Development
#Product/Service #Business Promotion Strategy #Diagram
-
Natural Environment Main Target Audience Analysis Donut Chart
#Market and Competitor Analysis #Graph #Other
