
Product/Service
Silhouette Diagram & Circle Donut Graph – Visual Tool for Customer Analysis
RJ0300066_22
- Last Update 12/21/2025
- File Size 0.1MB
- # of Slides 2
- File Format PPTX
- Slide Ratio 16:9
- Color
Keywords
About the Product
This slide utilizes a silhouette diagram and circle donut graph to effectively visualize customer analysis results within a single presentation tool. The blend of modern blue and yellow colors provides a high level of visual appeal, drawing attention and conveying corporate messages effectively. With a logical structure, this slide aids audience comprehension by presenting information flow clearly. It is particularly suitable for customer analysis and market and competitive analysis, combining practicality with a visually striking design.
Related Products
-
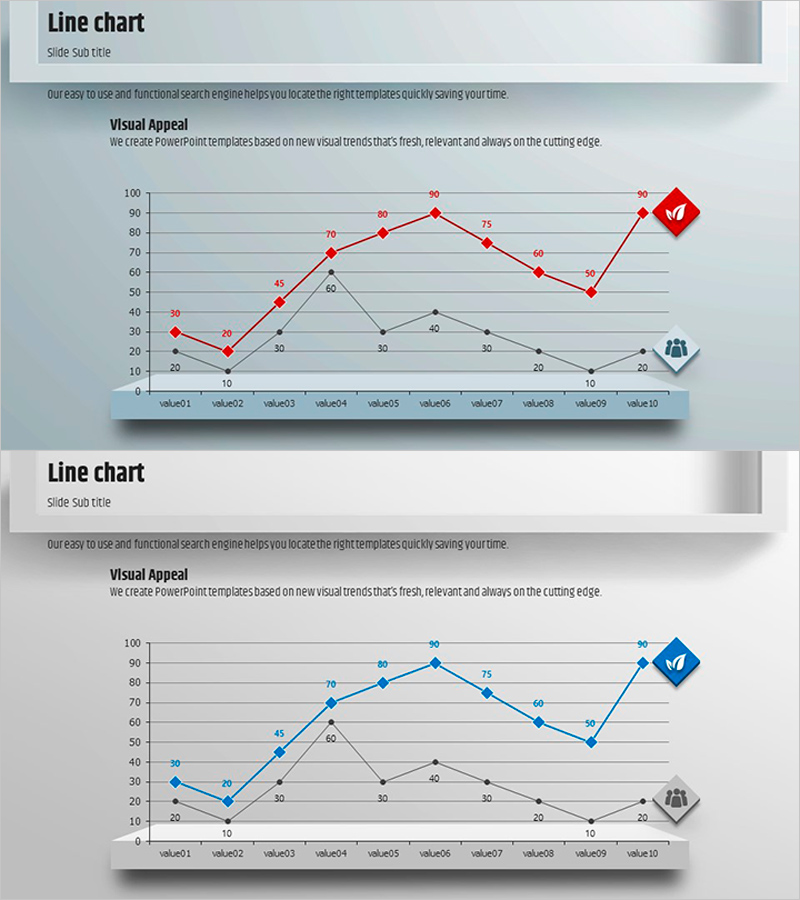
Square Frame Presentation Template for Line Chart – Market and Competitive Analysis
#Business Promotion Strategy #Market and Competitor Analysis #Graph
-
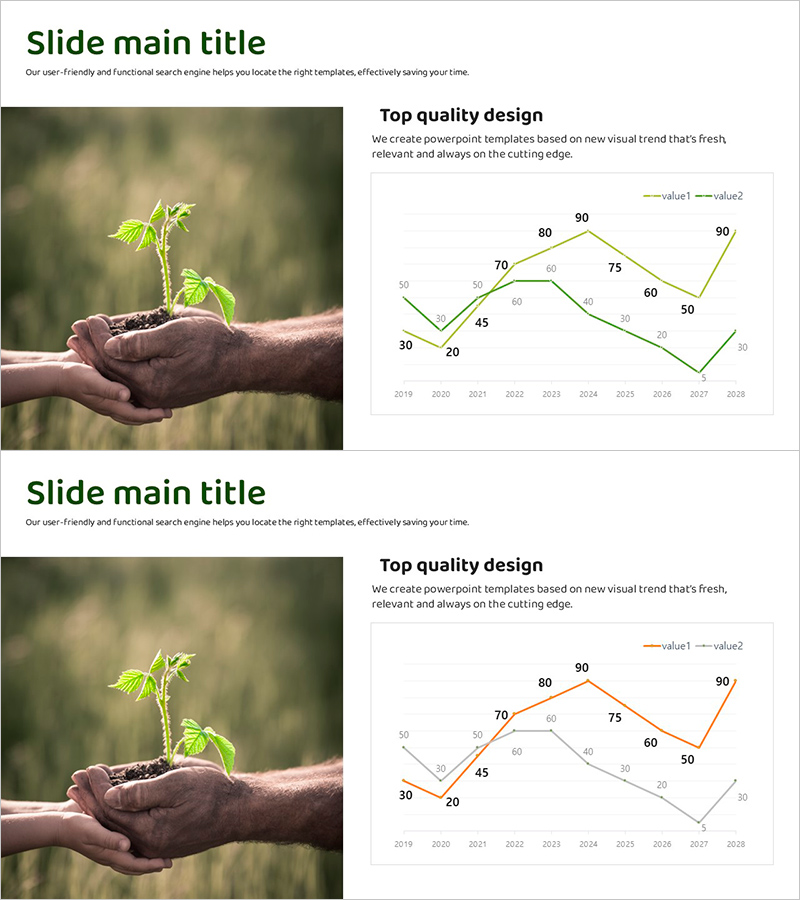
Eco-Friendly Service Graph – ESG and Social Responsibility
#Corporate Social Responsibility #Graph #Environmental Protection Efforts
-
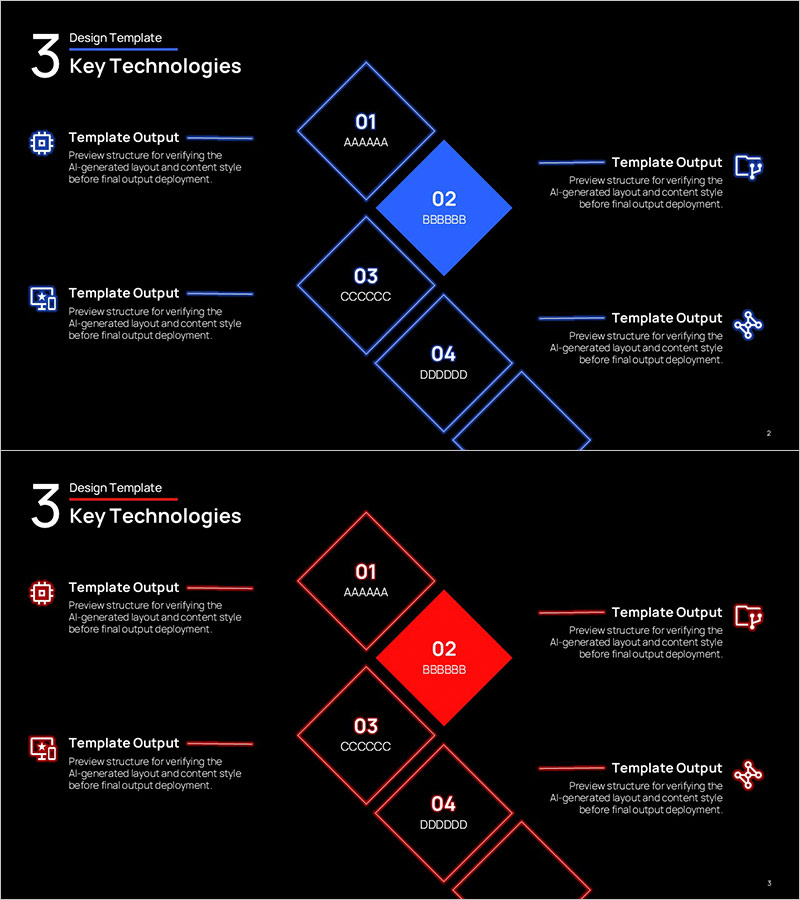
AI Neon Rhombus Visual Template – Product and Service Introduction
#Product/Service #Diagram #Features
-
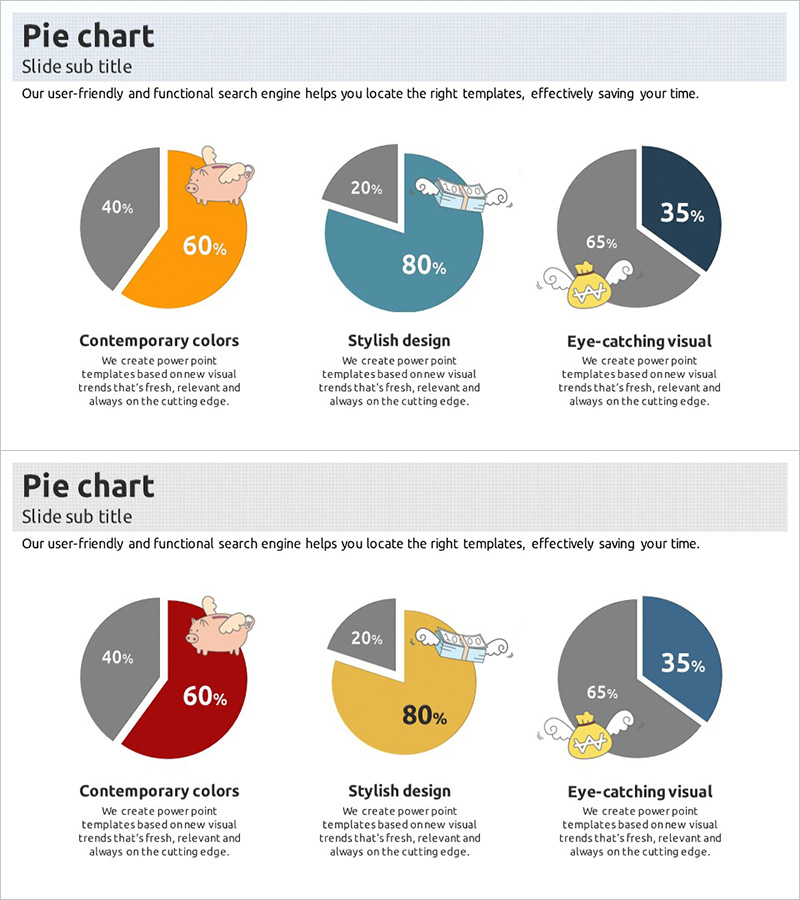
Market Share Analysis Graph – Effective Market Insights
#Market and Competitor Analysis #Graph #Market Share
