Eco-Friendly Service Graph – ESG and Social Responsibility
RJ0600103_24
- Last Update 07/18/2025
- File Size 0.9MB
- # of Slides 2
- File Format PPTX
- Slide Ratio 16:9
- Color
Keywords
About the Product
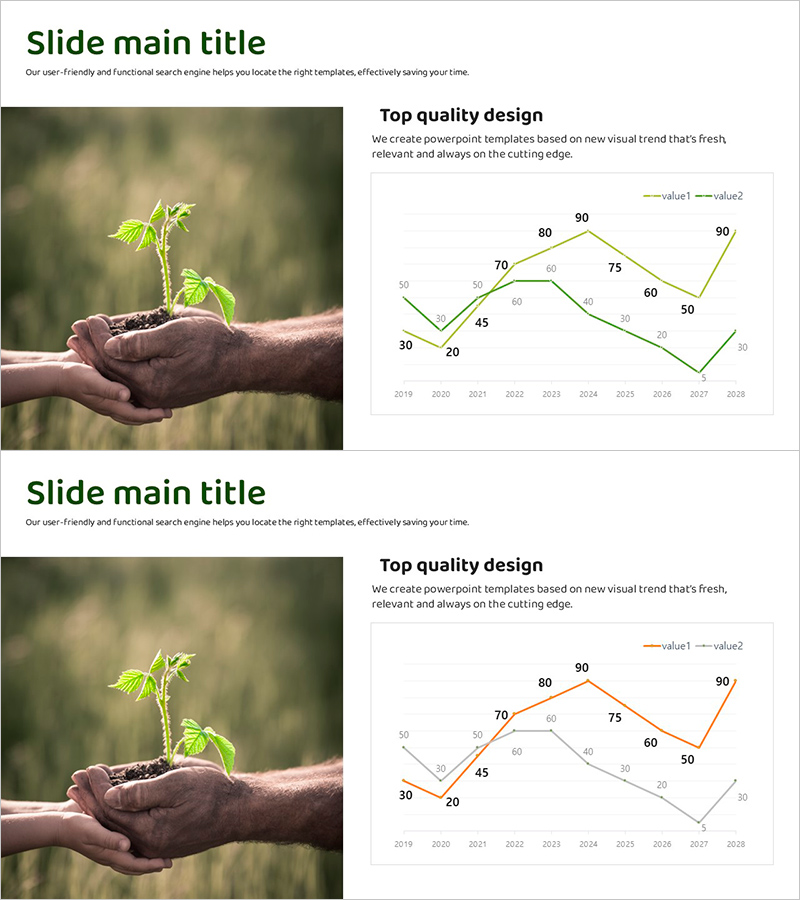
A dual-series line chart PowerPoint slide designed to visualize eco-friendly service performance and ESG metrics. Two data series are displayed in green and orange lines, tracking annual trends from 2019 to 2028 with precise numerical values at each data point. This presentation slide effectively compares two key indicators side by side, making it ideal for sustainability reports, ESG performance briefings, corporate responsibility presentations, and environmental policy communications. The chart structure supports clear trend analysis and year-over-year performance comparison.
Usage Points
-
Main Usage
Compares two key performance indicators over time, enabling audiences to understand parallel trends and relative performance changes. Ideal for presenting environmental metrics, sustainability KPIs, market share evolution, or any dual-metric analysis requiring temporal context.
-
How to Use
Insert into annual performance reports, investor presentations, ESG disclosures, or environmental strategy briefings. Replace data values with actual statistics, update the legend to reflect your specific metrics, and adjust the color scheme if needed to match corporate branding guidelines.
-
Recommended For
Sustainability officers, ESG program managers, investor relations professionals, corporate strategy teams, environmental compliance officers, and CSR project leads presenting performance metrics and trend analysis to stakeholders.
-
Slide Structure
Two-line chart with 10 data points per series spanning 2019–2028. X-axis displays years, Y-axis shows 0–100 scale. Green line (value1) and orange line (value2) are clearly differentiated by legend. Grid lines and numerical labels enhance readability and data accuracy.
Related Products
-

Connection-Diffusion Green Diagram – Social Responsibility and Environmental Protection
#Corporate Social Responsibility #Diagram #Environmental Protection Efforts
-

Cluster Diagram for 4 Eco-Friendly Action Strategies
#Corporate Social Responsibility #Diagram #Environmental Protection Efforts
-

Social Responsibility Diffusion Diagram – A New Vision for Environmental Protection
#Corporate Social Responsibility #Diagram #Environmental Protection Efforts
-

ESG Cost Saving Analysis Slide – Sustainability and Growth
#Business Vision and Strategy #Corporate Social Responsibility #Diagram
