Product/Service
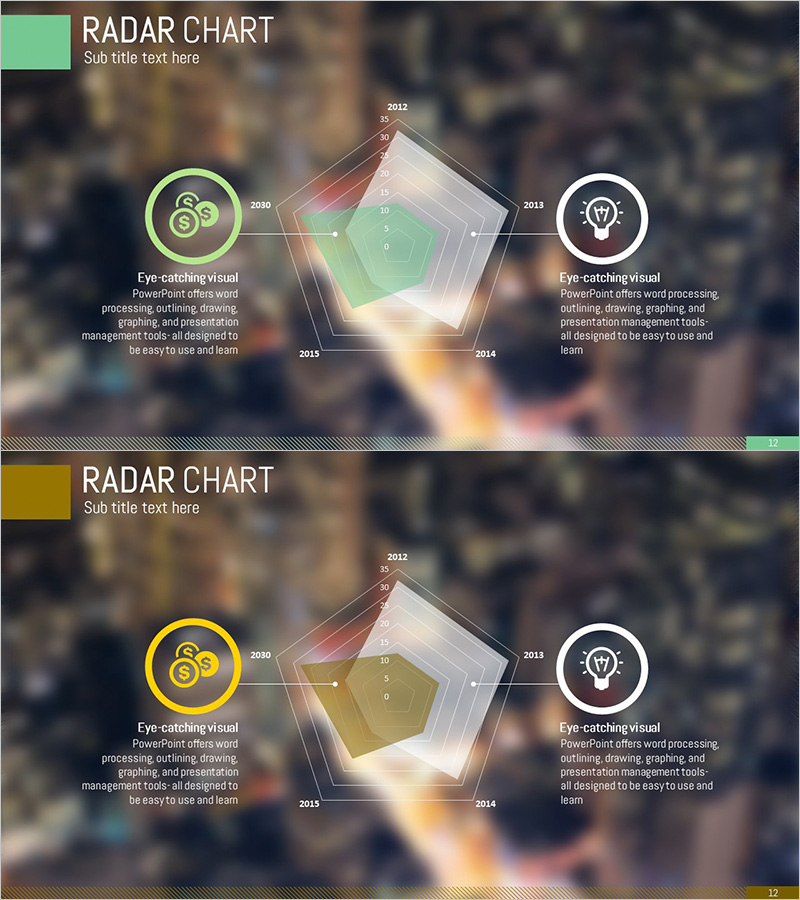
Technology Status Pentagon Area Diagram
RJ0300065_11
- Last Update 12/21/2025
- File Size 1.2MB
- # of Slides 2
- File Format PPTX
- Slide Ratio 16:9
- Color
Keywords
About the Product
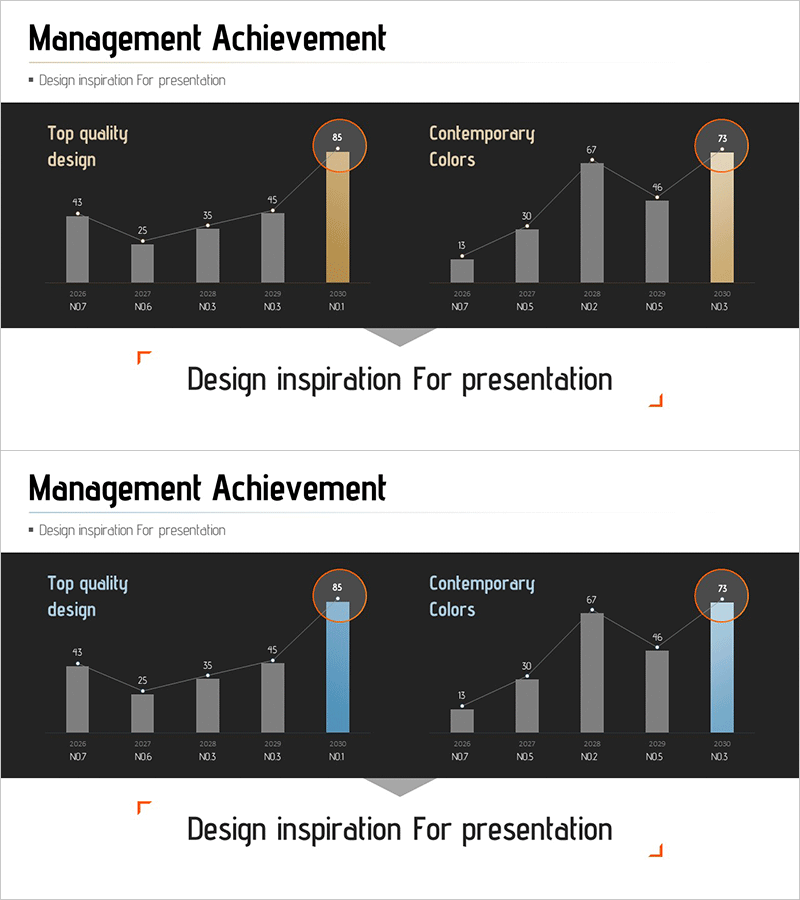
This slide features a Pentagon area diagram designed to visually represent technology status. It's useful for presenting complex technology data in a simple and intuitive manner, suitable for areas such as development planning, technology analysis, or business strategy. The flexible color combination of green, yellow, and brown captures the audience's attention and aids comprehension of information. This diagram emphasizes information relationships represented through clusters and connections, making it ideal for product and service introductions.
Related Products
-
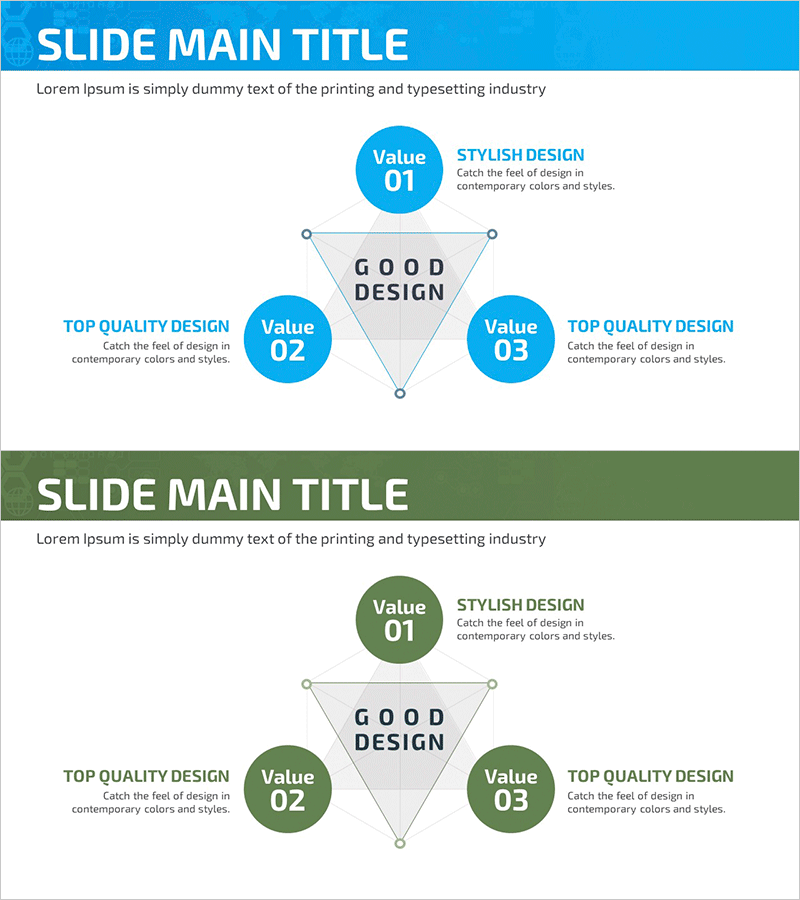
Business Area Triangle Diagram – Cluster for Business Introduction
#Business Introduction #Market and Competitor Analysis #Diagram
-
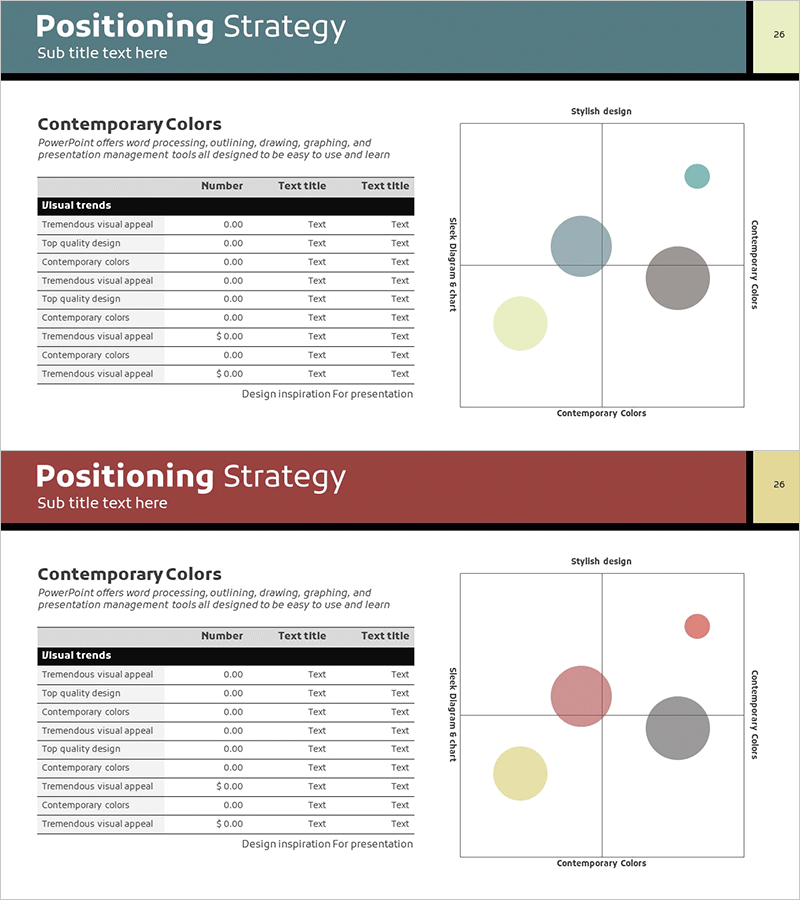
Strategic Positioning Map – Market Analysis and Marketing Strategy
#Market and Competitor Analysis #Marketing Plan and Strategy #Diagram
-
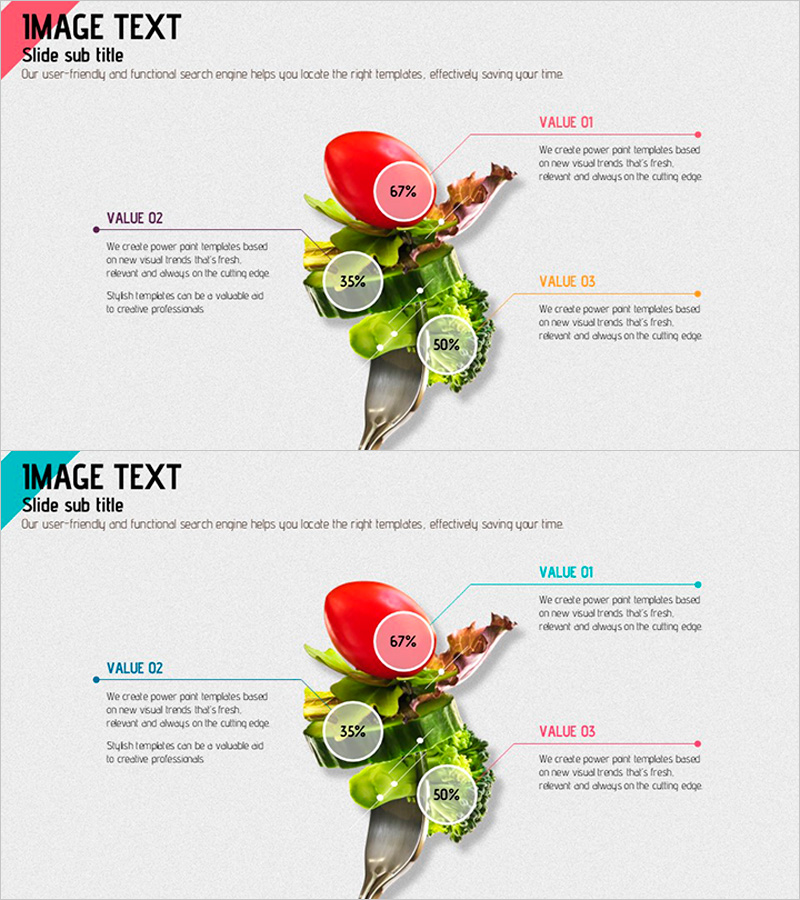
Dietary Diet Ingredients PowerPoint Slide – Capturing Health and Change
#Product/Service #Features #Composition
-
Management Performance Comparison Analysis Chart – Data-Driven Decision Making
#Business Promotion Strategy #Market and Competitor Analysis #Graph
