Product/Service
Composition Content Bar Graph – Information Delivery and Analysis
RJ0300064_5
- Last Update 12/21/2025
- File Size 0.2MB
- # of Slides 2
- File Format PPTX
- Slide Ratio 16:9
- Color
Keywords
About the Product
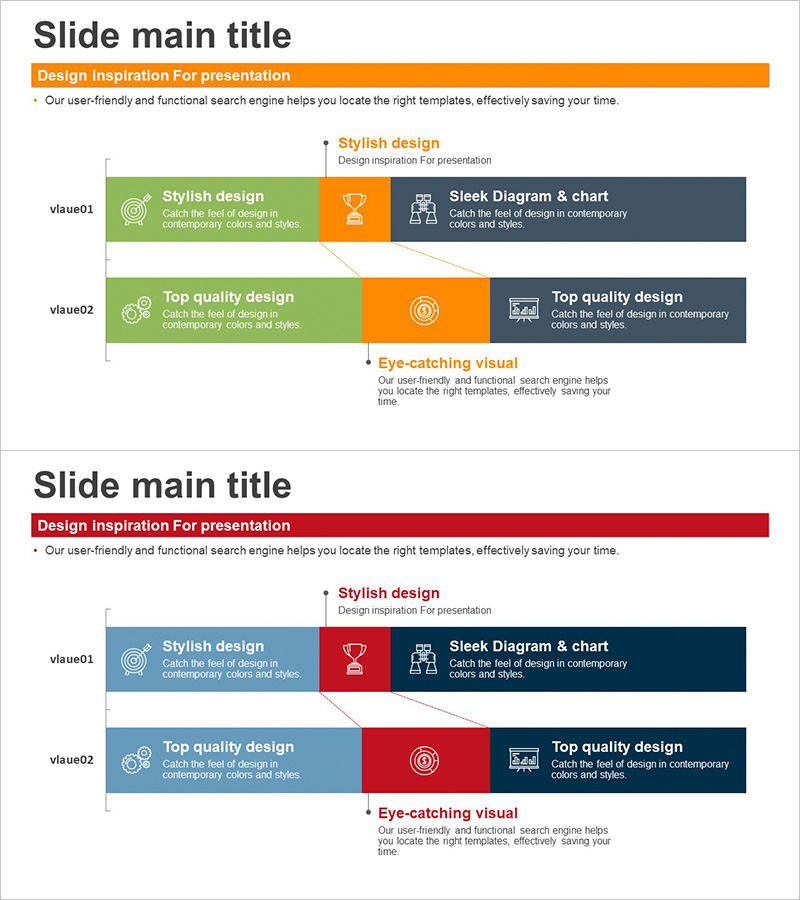
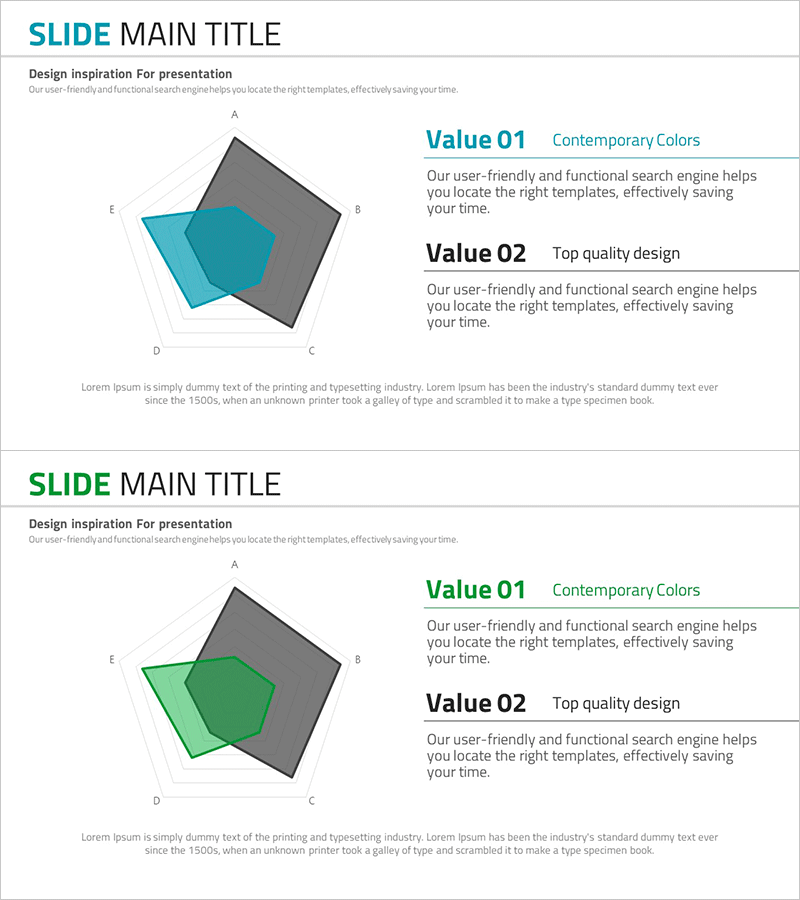
This slide presents composition content in a bar chart format, enabling visual representation of data. It allows for intuitive and segmented data expression and is particularly useful in fields like technology status and business introduction. The harmony of orange and red enhances visual appeal, making it suitable for reports, proposals, and presentations. The text and data elements can be easily replaced, with an editing difficulty rated as 'easy', allowing for quick integration into various presentations.
Related Products
-
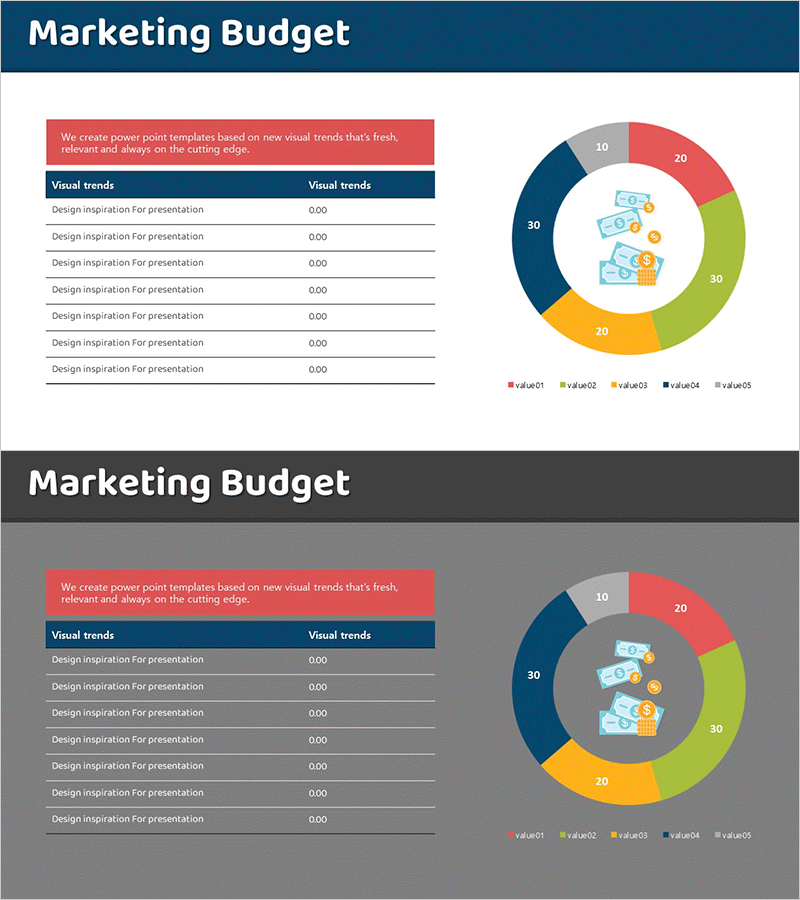
Marketing Budget Analysis Table & Donut Chart
#Financial Plans and Performance #Diagram #Graph
-
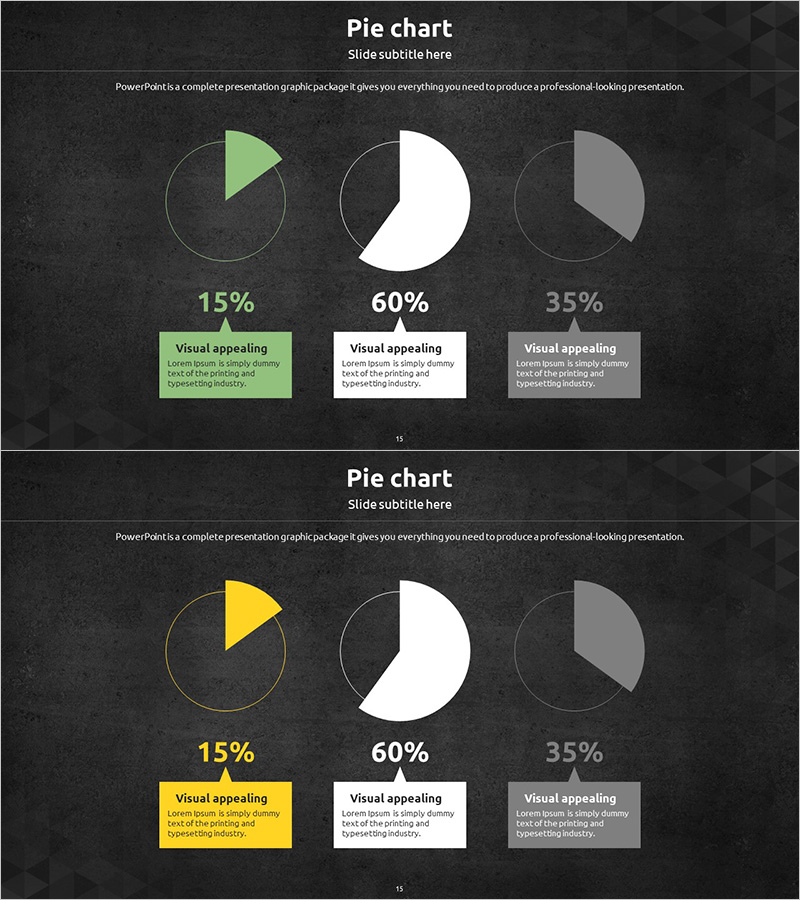
Market Share Circle Pie Chart
#Product/Service #Market and Competitor Analysis #Graph
-
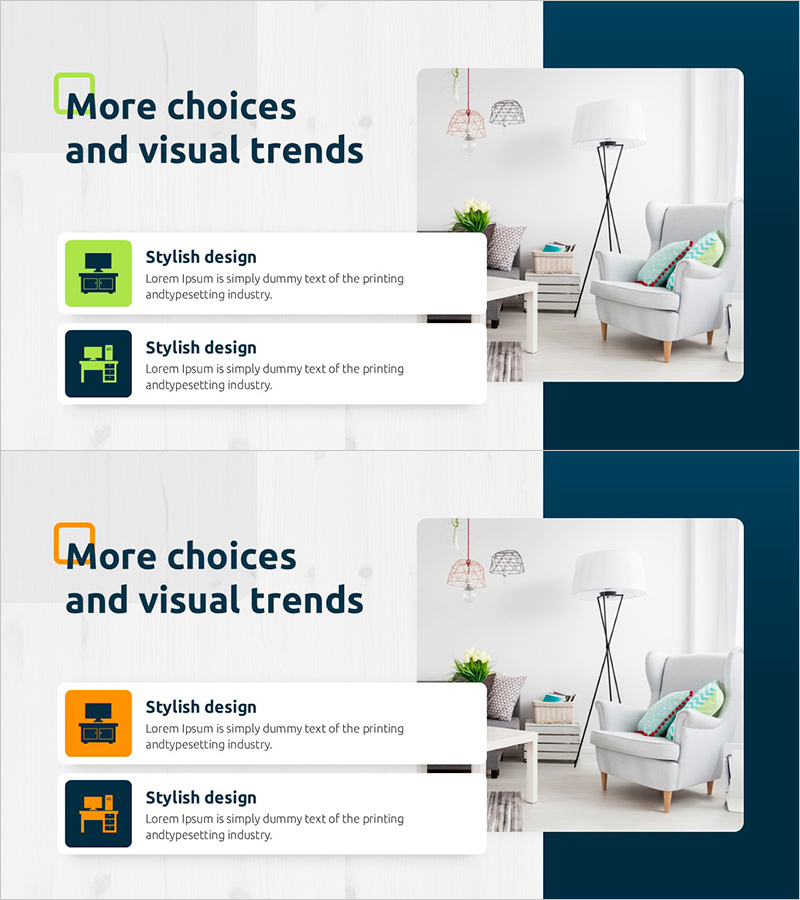
Product Features and Differences – Stylish Design
#Product/Service #Diagram #Features
-
Pentagon Radial Graph for Market Analysis and Strategy
#Market and Competitor Analysis #Marketing Plan and Strategy #Graph
