
Financial Plans and Performance
Sales and Profit Table – Statistical Financial Performance
RJ0300064_26
- Last Update 12/21/2025
- File Size 0.5MB
- # of Slides 2
- File Format PPTX
- Slide Ratio 16:9
- Color
Keywords
About the Product
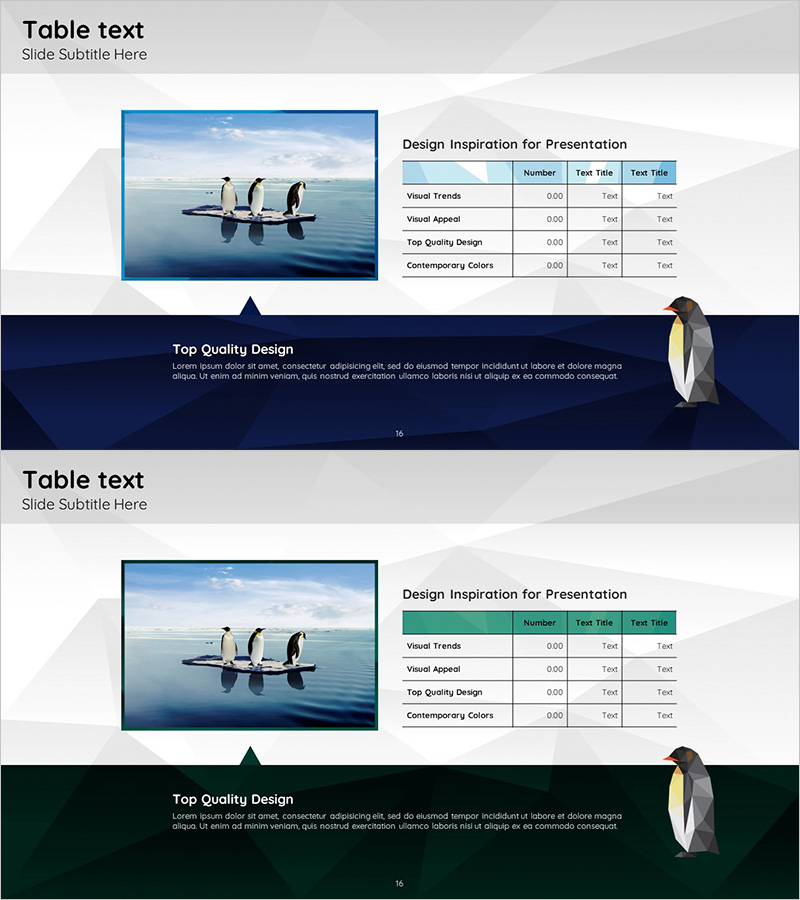
This slide features a table visualization designed to effectively present sales and profit information, clearly communicating financial planning and performance. The contrast of orange and red captures attention, providing a well-organized structure for data presentation that ensures easy understanding. In particular, its closed cluster arrangement allows related information to be neatly summarized and easily grasped. This slide is ideal for financial reports, management materials, and investment presentations in various business contexts. Editing difficulty is rated as 'easy', with straightforward replacement of text and data fields.
Related Products
-
Differentiation Strategy Blue Orange – Highlighting Business Vision and Core Competencies
#Product/Service #Business Vision and Strategy #Diagram
-
Introduction to Penguin Key Financial Indicators – Blue Green Diagram
#Financial Plans and Performance #Diagram #Key Financial Indicators
-
Data Analysis Graph Visualization for Market Competition
#Market and Competitor Analysis #Diagram #Graph
-
Company Overview Diagram – Clear Information Delivery
#Company Introduction #Diagram #Company Overview
