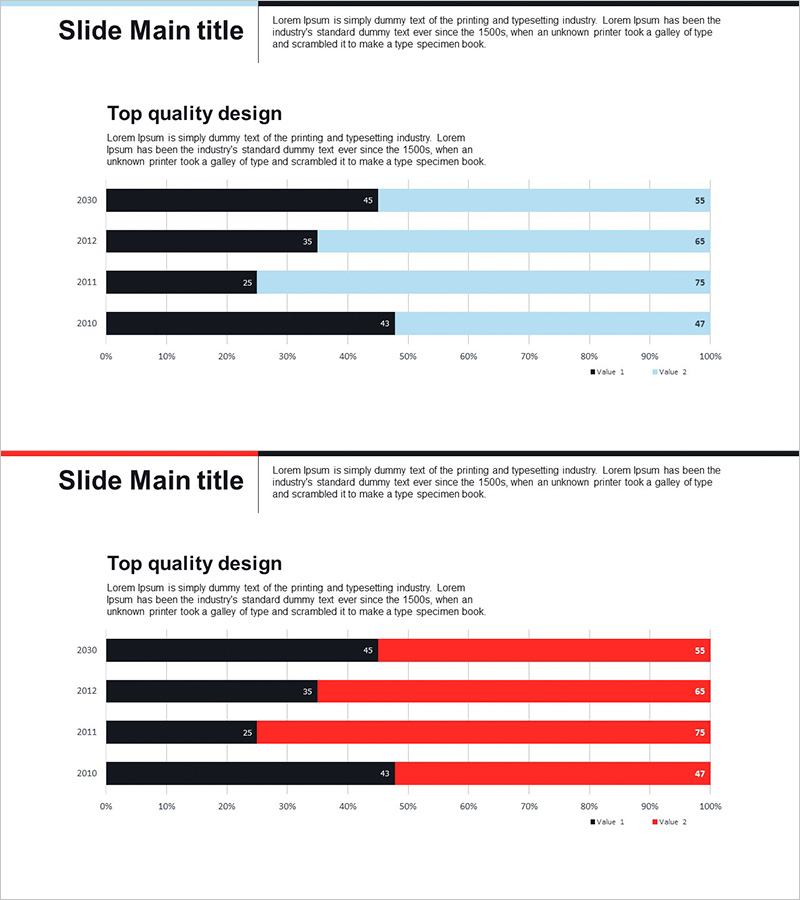
Market and Competitor Analysis
Segmented Bar Graph for Market Analysis Visualization
RJ0300062_9
- Last Update 12/21/2025
- File Size 0.1MB
- # of Slides 2
- File Format PPTX
- Slide Ratio 16:9
- Color
Keywords
About the Product
This slide effectively visualizes market analysis results using a segmented bar graph. Each data point is divided into distinct segments per year, clearly differentiated by color. This allows for easy comparison of competitor performance and market share, while the contrast between red and blue enhances visibility and leaves a strong impression in presentations. This slide is useful in various business contexts such as marketing strategies, investment proposals, and competitive analysis. Text and data fields can be easily replaced, making the editing difficulty level 'easy'.
Related Products
-
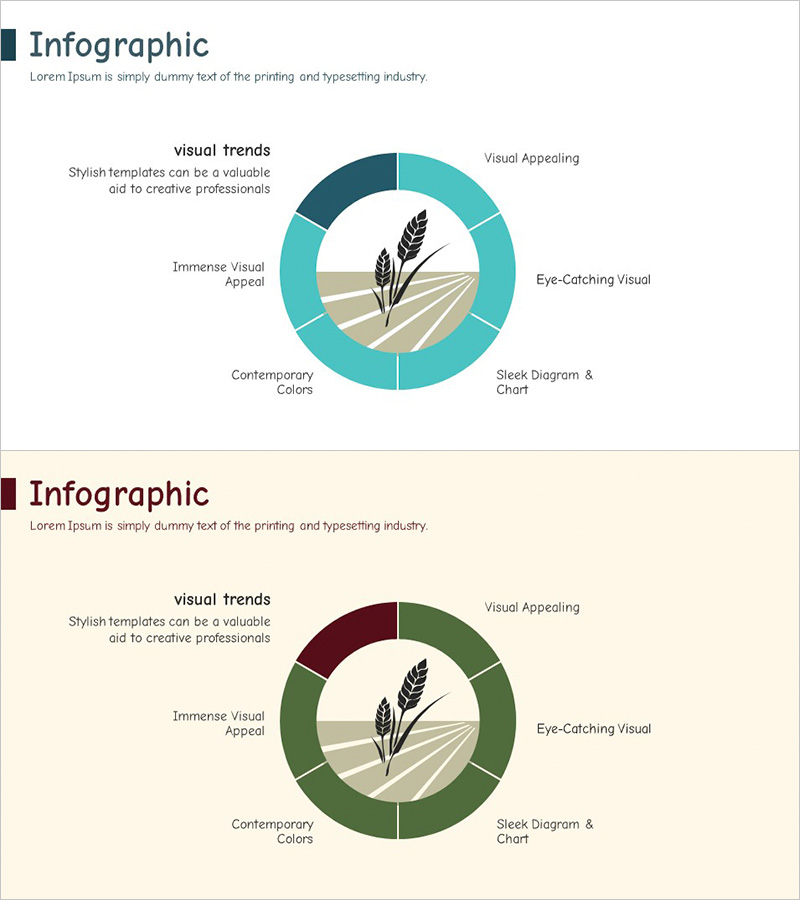
Silhouette Diagram & Circle Donut Graph – Visual Tool for Customer Analysis
#Product/Service #Market and Competitor Analysis #Graph
-

Introduction of Key Personnel Profiles – Power of Manpower and Unity
#Company Introduction #Market and Competitor Analysis #Diagram
-
Farm Aftercare and Maintenance Blue Green Template – Effective Market Analysis
#Market and Competitor Analysis #Diagram #Market Share
-
Visual Data Overview of Research Findings – Beginning of Innovation
#Market and Competitor Analysis #Graph #Market Analysis
