Business Promotion Strategy
Financial Business Process Diagram – Efficient Workflow
RJ0300061_29
- Last Update 12/21/2025
- File Size 1.9MB
- # of Slides 2
- File Format PPTX
- Slide Ratio 16:9
- Color
Keywords
About the Product
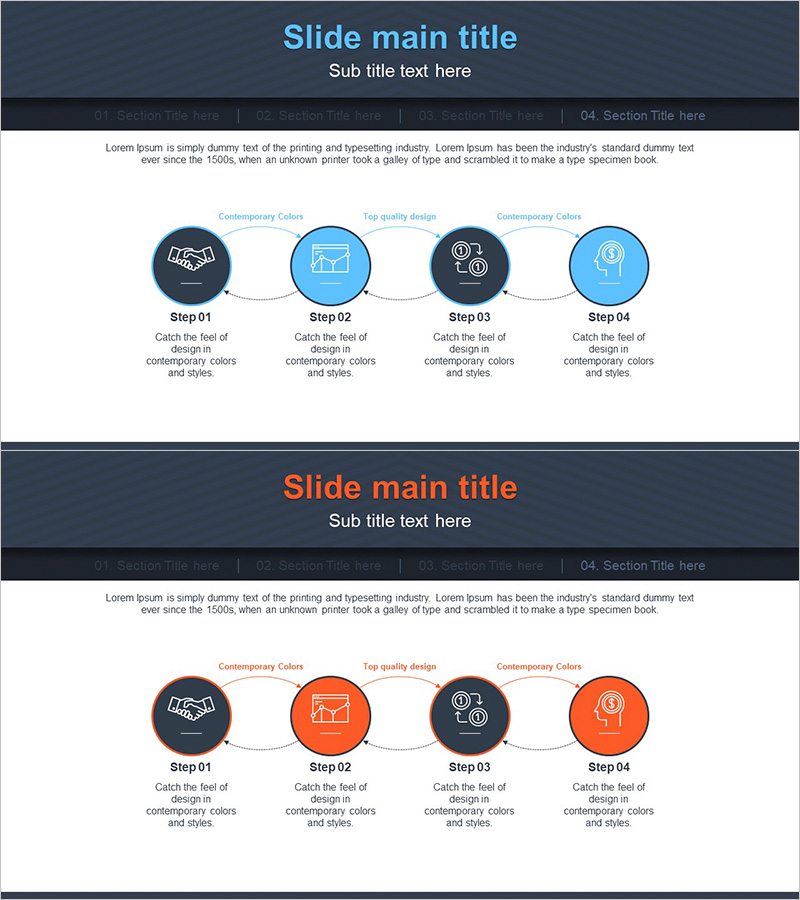
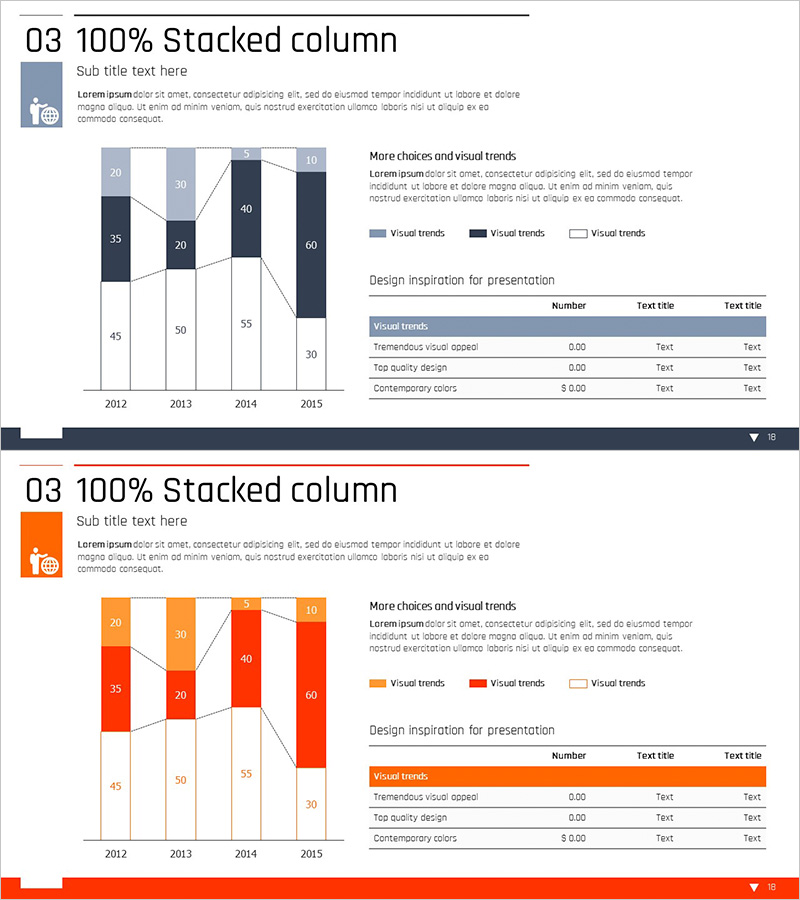
This slide features a diagram that visually represents financial business processes. It clearly outlines step-by-step workflows and various processes, utilizing blue and orange colors to convey stability and energy. This design is suitable for business plans, reports, and strategic documents, assisting effective communication with its circular and interconnected structure. Users can easily explain complex processes and promote efficient collaboration among team members. The design is simple to modify, allowing for easy information replacement.
Related Products
-
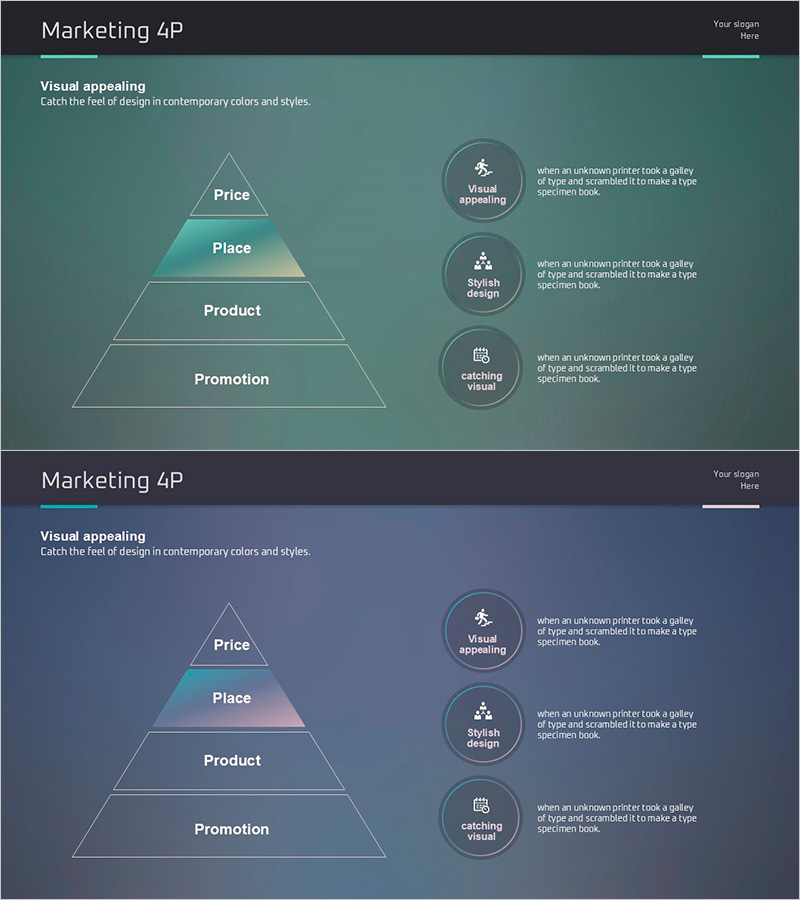
Idea Presentation Template Wide Pyramid Diagram
#Marketing Plan and Strategy #Diagram #Marketing Strategy
-
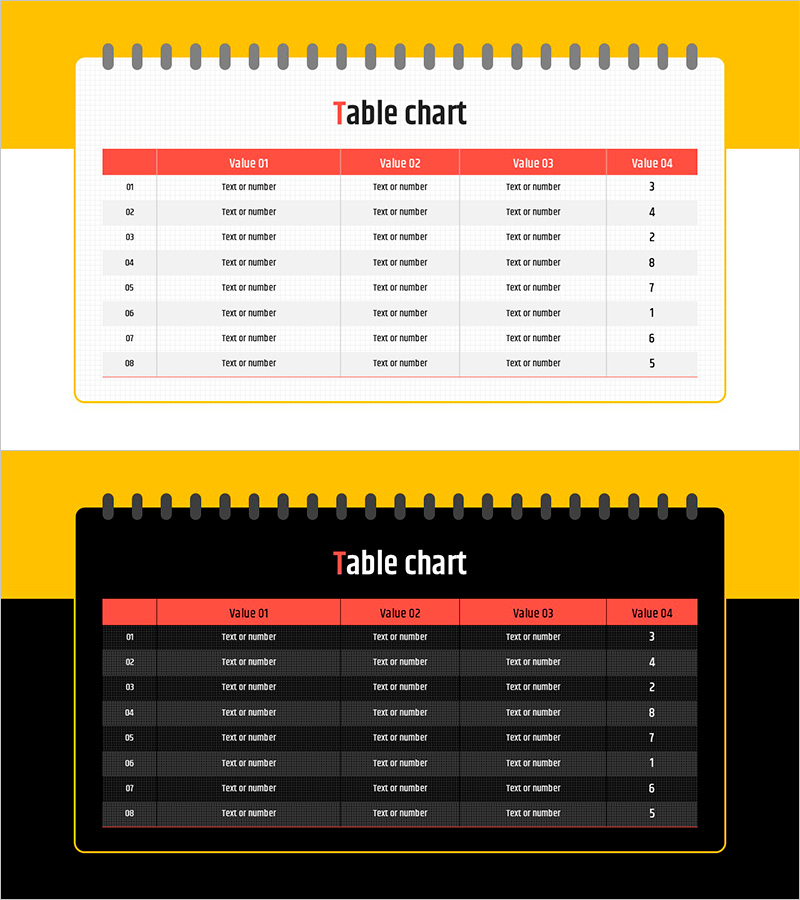
Table Chart of Notepad Frames – Practical Data Representation
#Diagram
-
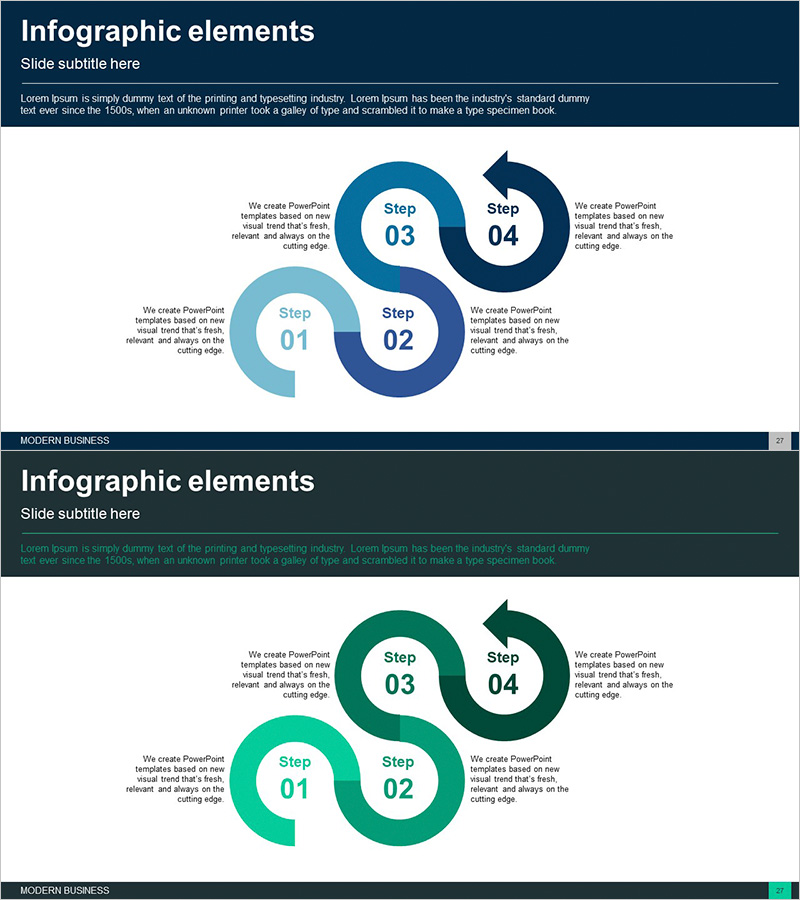
4STEP Circular Connection Diagram – Business Execution Strategy
#Business Promotion Strategy #Operation Plan #Diagram
-
Subdivided Graphs and Tables Slide – Market Analysis and Performance Data
#Market and Competitor Analysis #Financial Plans and Performance #Diagram
