Table Chart of Notepad Frames – Practical Data Representation
RJ0500047_24
- Last Update 06/20/2025
- File Size 0.2MB
- # of Slides 2
- File Format PPTX
- Slide Ratio 16:9
- Color
Keywords
About the Product
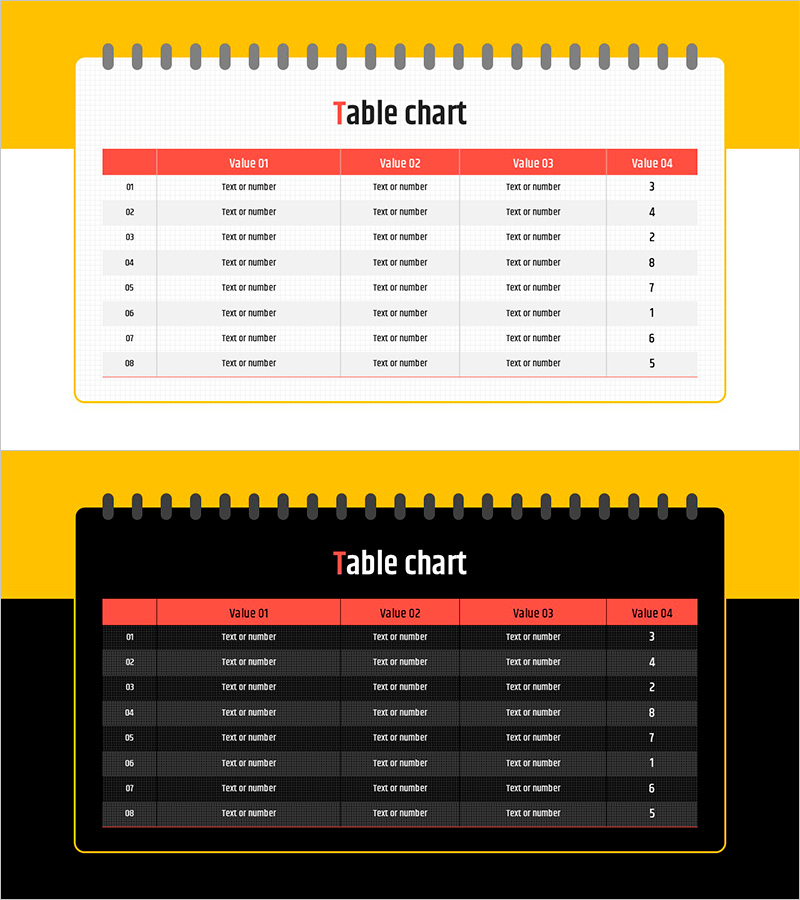
A notepad-framed table chart PowerPoint slide designed for systematic data organization and comparison. Features 8 rows and 4 columns with a red header row that emphasizes information hierarchy. Two design versions are included: a light version with white background and a dark version with black background, allowing you to match your presentation environment and document tone. Ideal for business reports, market analysis, performance data, cost comparisons, and financial summaries. Text and numerical values are clearly organized for quick reference and professional presentation impact.
Usage Points
-
Main Usage
Organizes numerical data, text, and items in rows and columns for clear comparison and analysis. The red header row visually distinguishes key information and creates a professional data presentation structure.
-
How to Use
Use in reports to present market data, sales performance, cost comparisons, product specifications, or financial metrics. Select the light version for bright presentation environments and the dark version for dark rooms or video backgrounds.
-
Recommended For
Recommended for executives, business analysts, financial professionals, sales managers, and project managers who need to present data comparisons, quarterly results, market research findings, product comparisons, and financial reports.
-
Slide Structure
8 rows (01–08) and 4 columns (Value 01–04) in table format. Header row features red background with white text for emphasis. Data rows alternate between light gray and white for improved readability. Both slides maintain identical structure with light and dark design options.
Related Products
-

Nested Darts Infographic – Aligning Marketing Goals
#Marketing Plan and Strategy #Diagram #Marketing Objectives
-

SWOT Analysis Summary Diagram
#Market and Competitor Analysis #Diagram #SWOT Analysis
-

Learning System Cycle Diagram – Design for Efficient Operational Planning
#Operational Plan #Technical Approach #Diagram
-

App-Based Personal Workout Booking System – Intuitive Diagram
#Product/Service Introduction #Diagram #Other
