Technology Sector
Business Area Analysis Graph & PC Mockup
RJ0300059_27
- Last Update 12/21/2025
- File Size 1MB
- # of Slides 2
- File Format PPTX
- Slide Ratio 16:9
- Color
Keywords
- #Content-Based Slides
- #Design-Based Slides
- #Technology Sector
- #Market and Competitor Analysis
- #Graph
- #Other
- #Research and Development
- #Market Analysis
- #Horizontal Bar
- #Segmented Horizontal Bar
- #Mockup
- #16:9
- #business area
- #analysis graph
- #PC mockup
- #market analysis
- #competition analysis
- #horizontal bar
- #stacked
About the Product
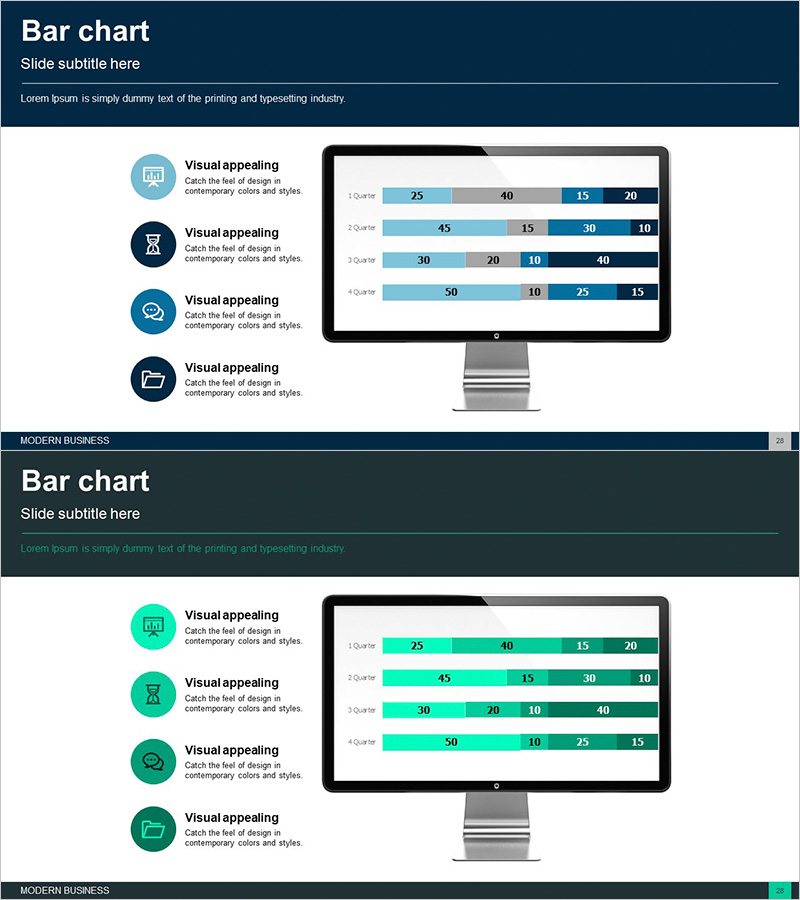
This slide offers a horizontal bar graph for business area analysis along with an actual PC mockup to maximize data visualization. The navy and green color scheme provides visual stability while conveying a modern feel, clearly showcasing performance by quarter. It can effectively be utilized in technical fields, R&D, and market analysis, making it ideal for market and competitive analysis reports and presentations.
Related Products
-
Visualizing Competitive Advantage with Circular Gauge Charts
#Product/Service #Market and Competitor Analysis #Graph
-
Purple Brown Competitive Advantage Donut Graph – Visualizing Market Share
#Market and Competitor Analysis #Graph #Market Share
-
Comparative Analysis Split Bar Graph – Reliable Market Analysis
#Market and Competitor Analysis #Graph #Competitor Analysis
-
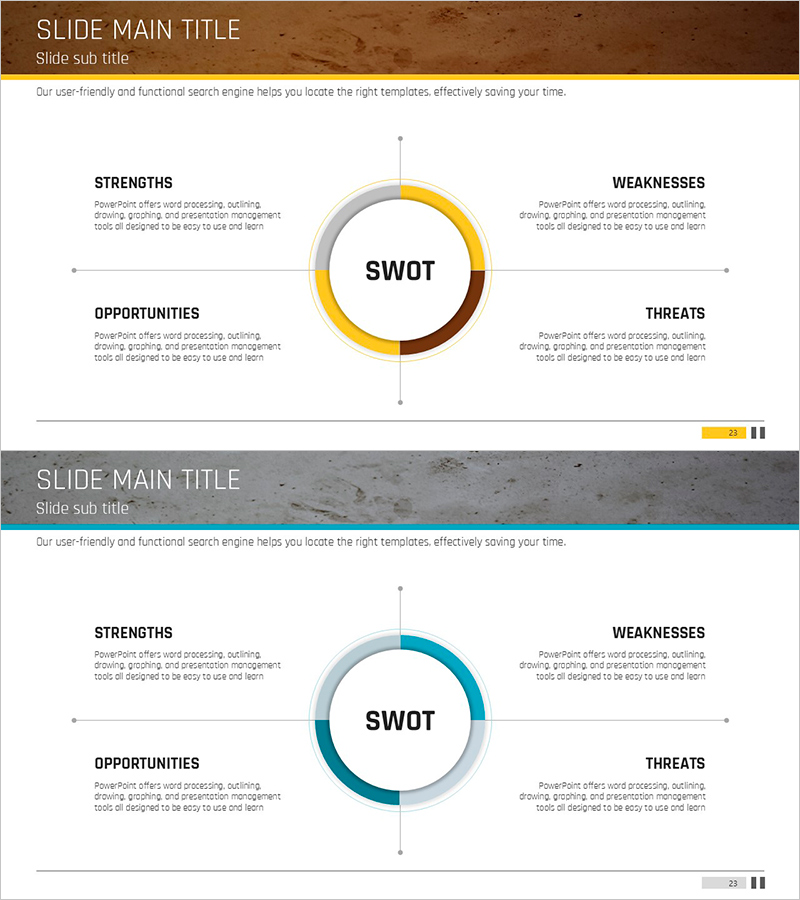
Brown Blue SWOT Analysis – Beyond Opportunities and Threats
#Market and Competitor Analysis #Diagram #SWOT Analysis
