Market and Competitor Analysis
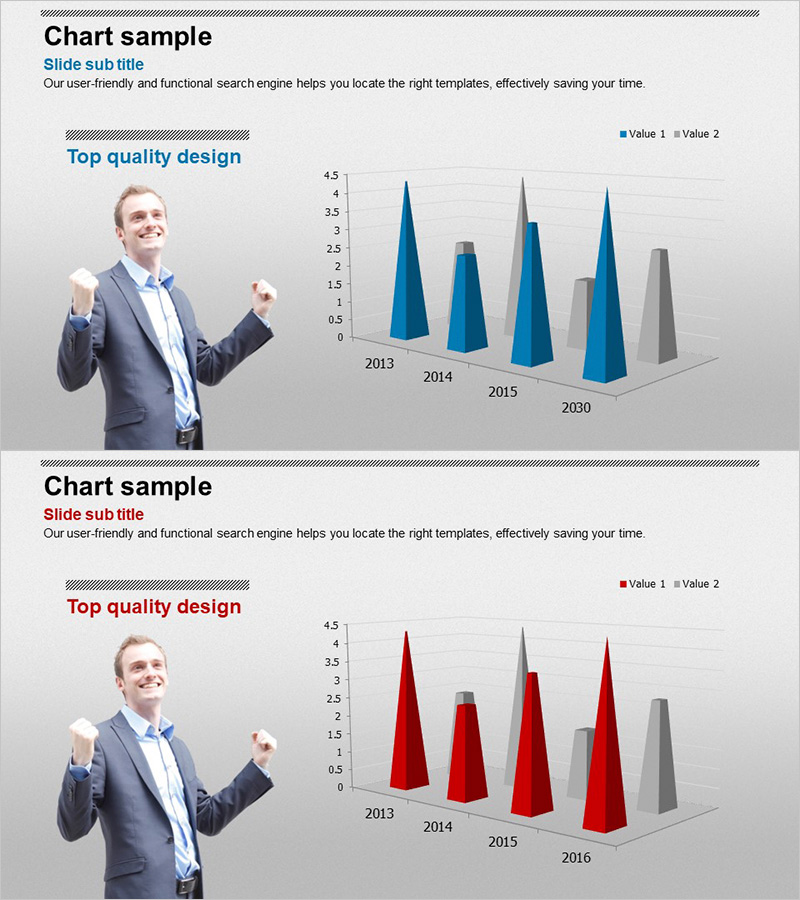
Triangular Prism Graph for Visualizing Market Status – Insights and Analysis
RJ0300053_12
- Last Update 12/21/2025
- File Size 1.8MB
- # of Slides 2
- File Format PPTX
- Slide Ratio 16:9
- Color
Keywords
About the Product
This slide utilizes a triangular prism graph to visually convey the market status clearly. The 3D effect enhances the impact of the data, making it effective for comparing annual figures. The vibrant blue and red contrast captivates the audience, making it suitable for market trend analysis or competitor comparison presentations. Text and data fields are easily interchangeable, with an editing difficulty rated as moderate. It can be immediately applied to various business contexts such as economic analysis, sales presentations, and strategic meetings.
Related Products
-
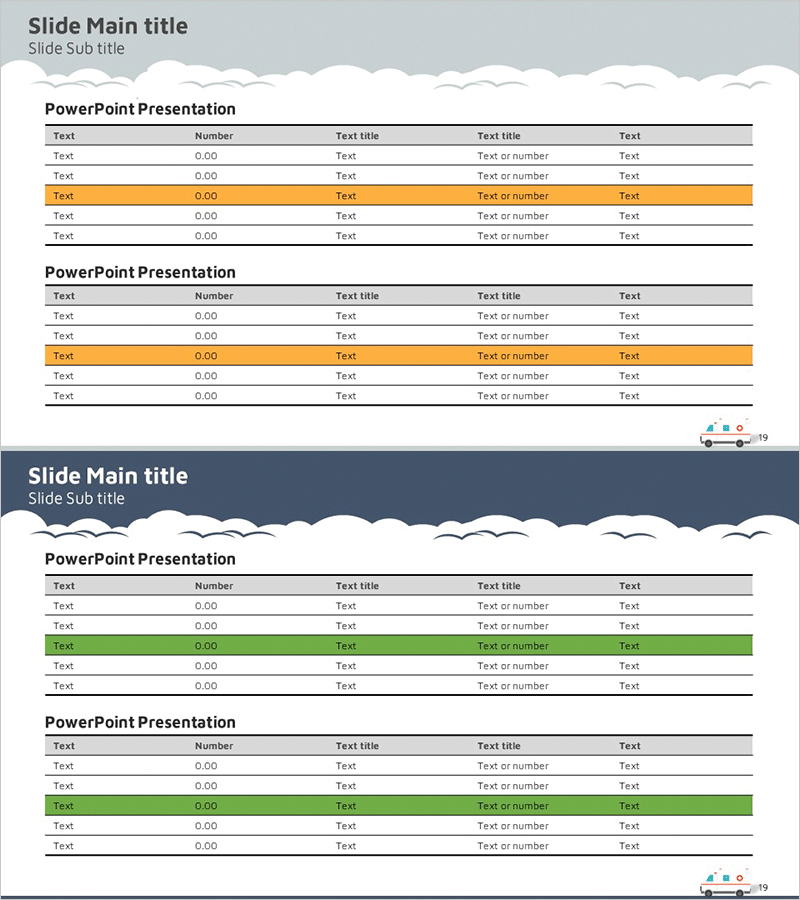
Market Analysis Horizontal Table – Optimized for Data Comparison
#Market and Competitor Analysis #Diagram #Market Analysis
-

Global Target Market Data Analysis - Insights into Markets
#Market and Competitor Analysis #Marketing Plan and Strategy #Diagram
-
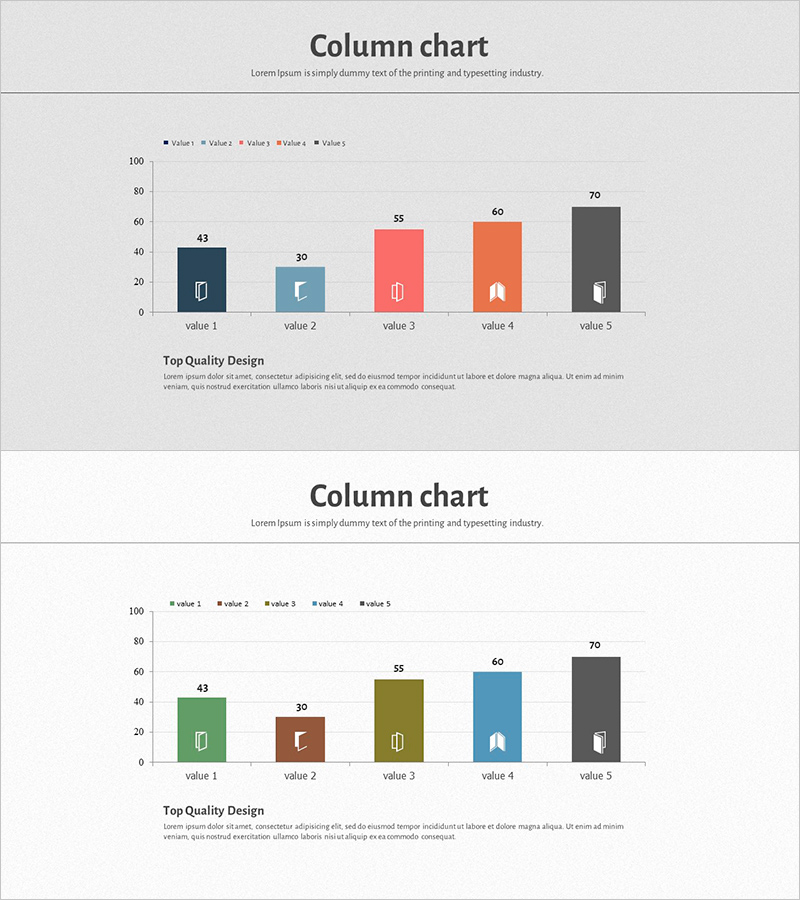
Square Frame Template Column Chart – Business Performance Report
#Business Promotion Strategy #Financial Plans and Performance #Graph
-

U.S. National Renewable Energy Implementation Regional Analysis - Green Mint
#Market and Competitor Analysis #Marketing Plan and Strategy #Other
