U.S. National Renewable Energy Implementation Regional Analysis - Green Mint
RJ0600048_18
- Last Update 07/03/2025
- File Size 2.1MB
- # of Slides 2
- File Format PPTX
- Slide Ratio 16:9
- Color
Keywords
About the Product
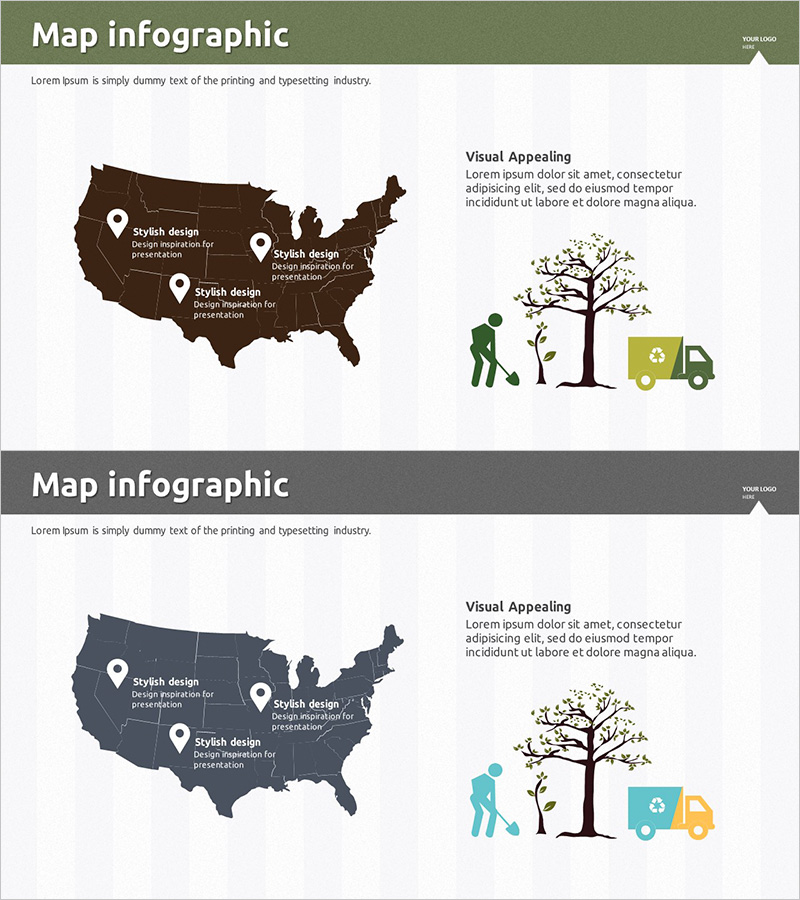
This slide presents a visual analysis of renewable energy implementation across the U.S. The stylish map infographic highlights regional characteristics while emphasizing eco-friendly elements. It can be utilized for marketing strategies or market analysis presentations.
Usage Points
-
Main Usage
- This template serves as a resource for presenting data on renewable energy trends in the United States, making it suitable for educational sessions or stakeholder meetings focused on sustainability initiatives.
-
How to Use
- It can be effectively used during quarterly reviews to assess progress in renewable energy projects, facilitating discussions among team members about future strategies and areas for improvement.
-
Recommended For
- Ideal for analysts, project managers, and educators seeking to share insights on renewable energy developments, particularly in settings such as corporate meetings or academic conferences.
-
Slide Structure
- The structure includes an introductory slide that sets the context, followed by a detailed analysis of different regions, and concludes with actionable insights for decision-makers, ensuring a logical flow for the audience.
Related Products
-

Simple Design Trend Wide PPT Map
#Market and Competitor Analysis #Marketing Plan and Strategy #Other
-

Country Analysis Map Graph for Market Insights
#Market and Competitor Analysis #Marketing Plan and Strategy #Graph
-

Purple Curved Theme Map Template for Market and Competitor Analysis
#Market and Competitor Analysis #Marketing Plan and Strategy #Other
-

Market Analysis with Hologram Map and Chart – Contemporary Visual Design
#Market and Competitor Analysis #Marketing Plan and Strategy #Other
