Market and Competitor Analysis
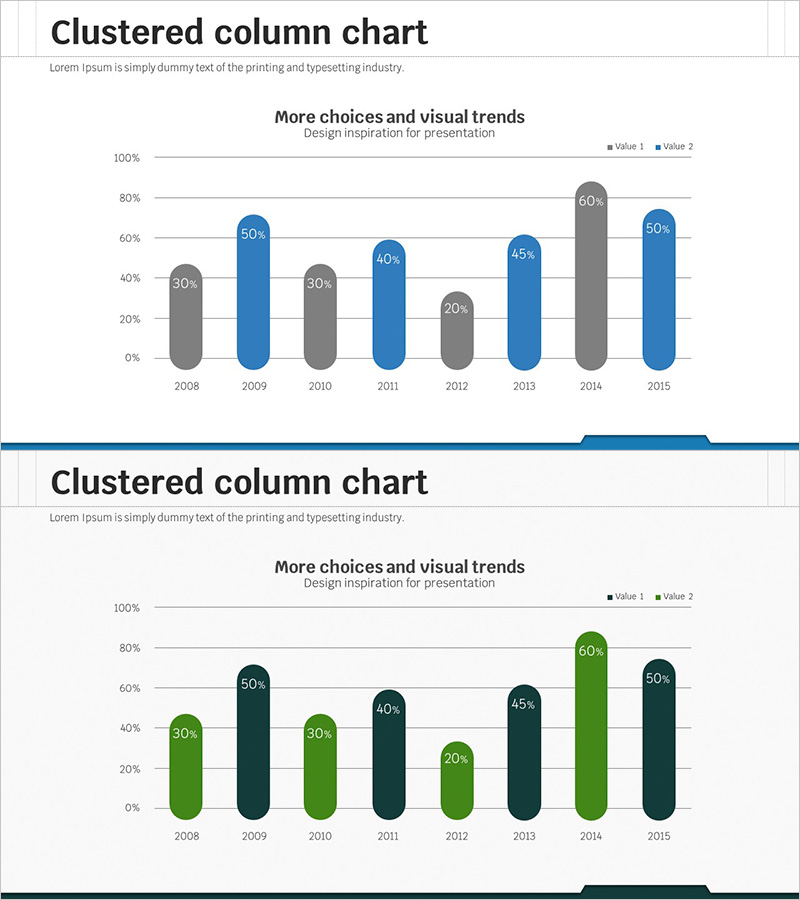
Visualizing Market Analysis with Yearly Round Bar Graph
RJ0300046_17
- Last Update 12/21/2025
- File Size 3.4MB
- # of Slides 2
- File Format PPTX
- Slide Ratio 16:9
- Color
Keywords
About the Product
This slide uses a yearly round bar graph to intuitively visualize market analysis data. The graph is designed to easily compare market changes, featuring a visually appealing blue and green color scheme. It is suitable for competitor analysis and market trend evaluation, with easily replaceable text and data fields rated as 'easy' to edit. This content is ideal for executive reports or investment proposals.
Related Products
-
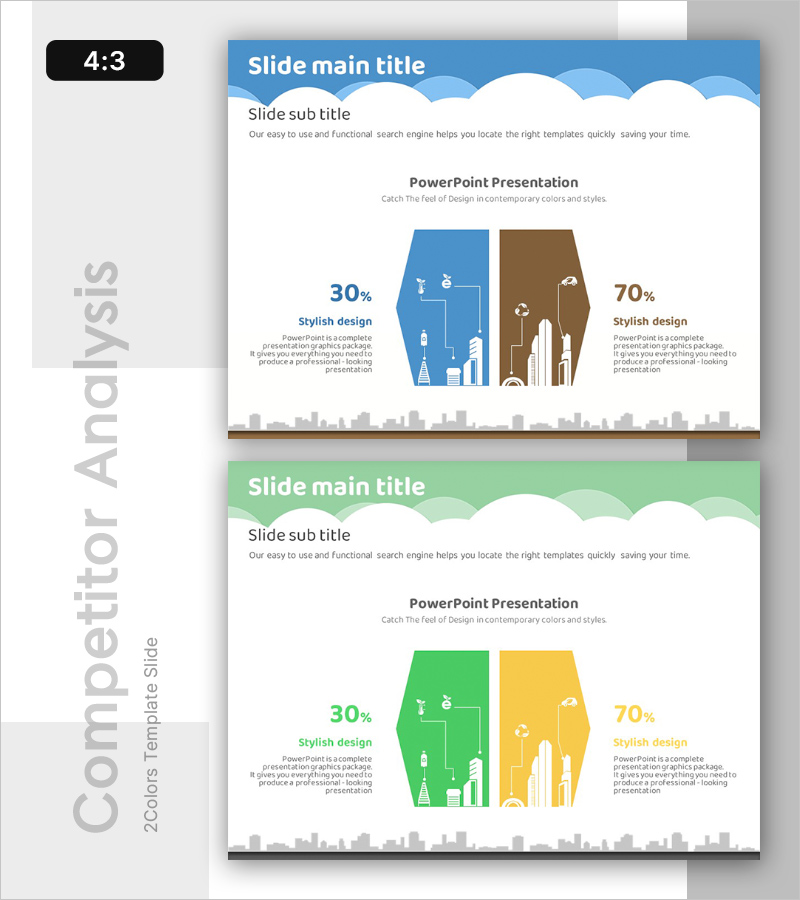
Diagram for Sustainable Market Size Analysis & Competitor Insights
#Market and Competitor Analysis #Diagram #Market Status
-
Market Analysis Bundle Vertical Bar Graph – Visualizing Business Performance
#Market and Competitor Analysis #Graph #Market Analysis
-
Gardening Illustration Graph Analysis – Securing Market Competitiveness
#Market and Competitor Analysis #Graph #Other
-

Simple & Modern Wide PPT SWOT Analysis - Intuitive and Clear Visualization
#Market and Competitor Analysis #Text Box #SWOT Analysis
