Market and Competitor Analysis
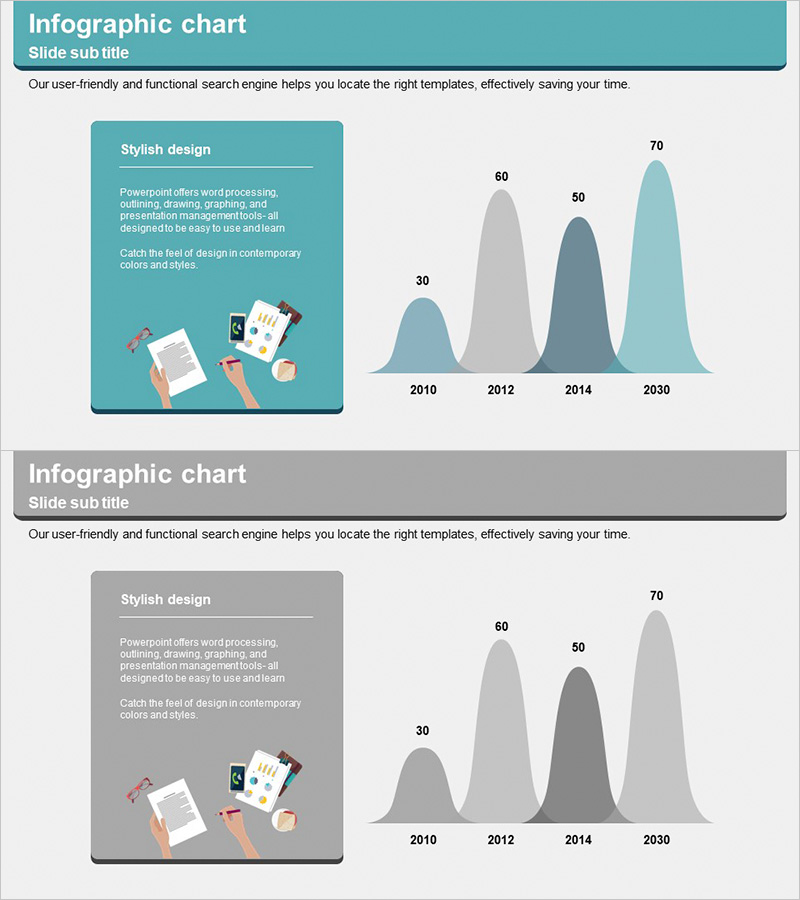
Idea Analysis Graph – Market Analysis Visualization
RJ0300045_31
- Last Update 12/21/2025
- File Size 0.4MB
- # of Slides 2
- File Format PPTX
- Slide Ratio 16:9
- Color
Keywords
About the Product
This slide utilizes the Idea Analysis Graph to stylishly visualize market analysis. It presents forecasted data from 2010 to 2030 using a teal and gray palette. With a clean and easily understandable layout, each year's data is distinctly compared, making it ideal for business strategy reports or market research presentations. Additionally, it is easy to modify to fit the presenter’s desired visual elements, with an overall editing difficulty rated as 'easy'.
Related Products
-

Post-Retirement Health Care Slide – Eye-catching Design and Practicality
#Product/Service #Operation Plan #Other
-

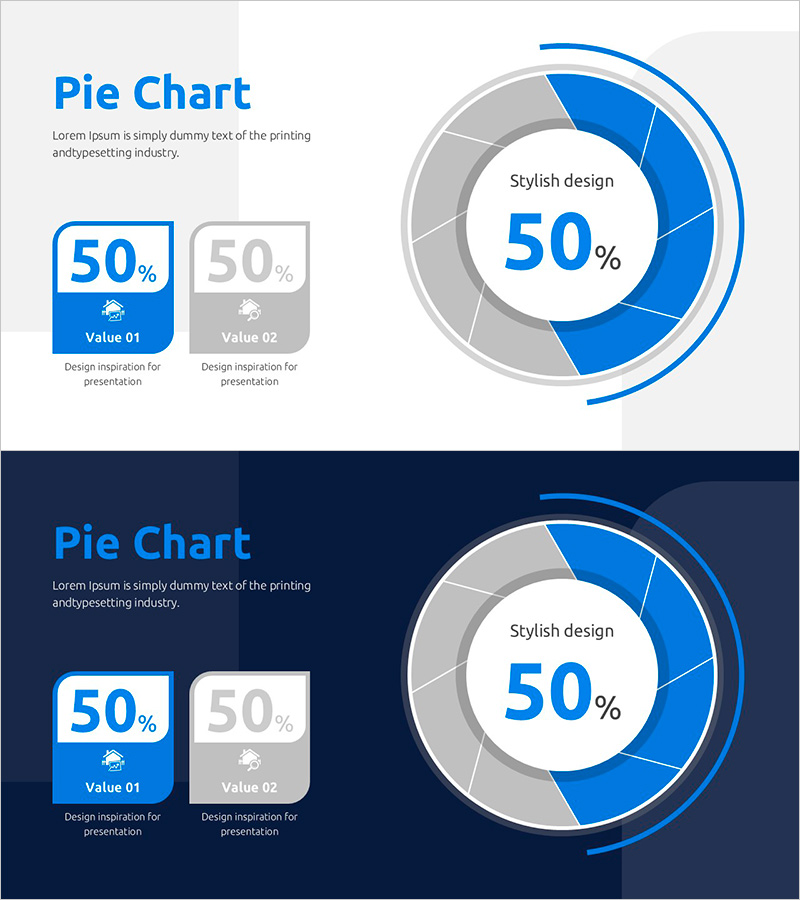
Donut Chart of the Share of Real Estate Ownership – For Market Analysis
#Market and Competitor Analysis #Graph #Market Status
-
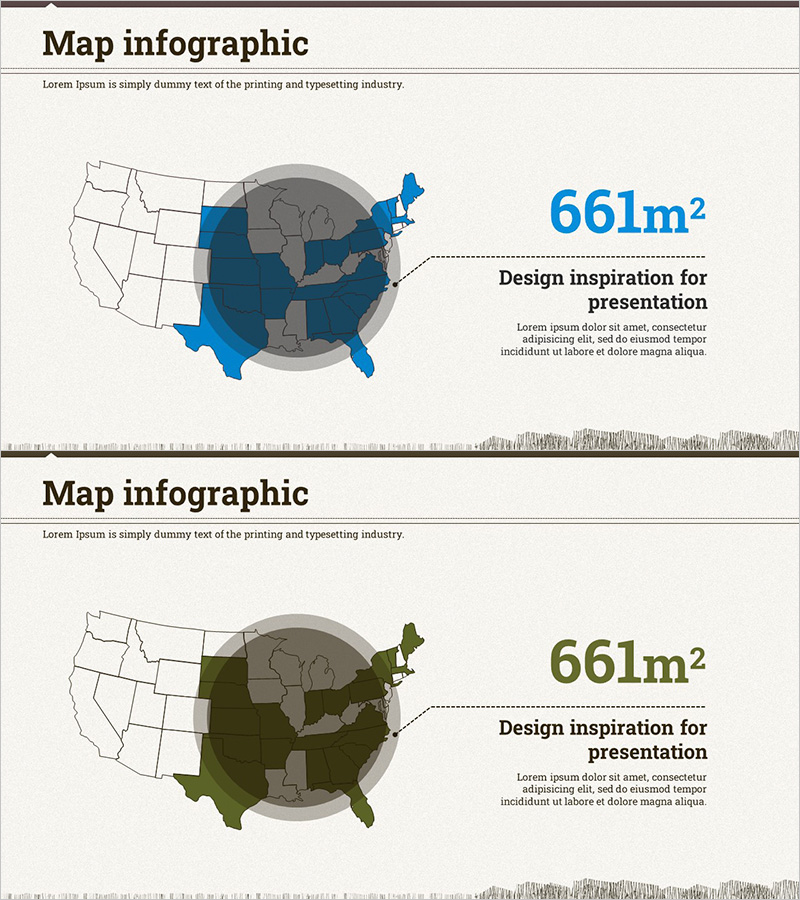
Analysis of Agricultural Territory Size by Region in the United States – Productivity and Strategy
#Market and Competitor Analysis #Marketing Plan and Strategy #Other
-
Market Status Chart for Point Frame
#Market and Competitor Analysis #Financial Plans and Performance #Diagram
