Business Introduction
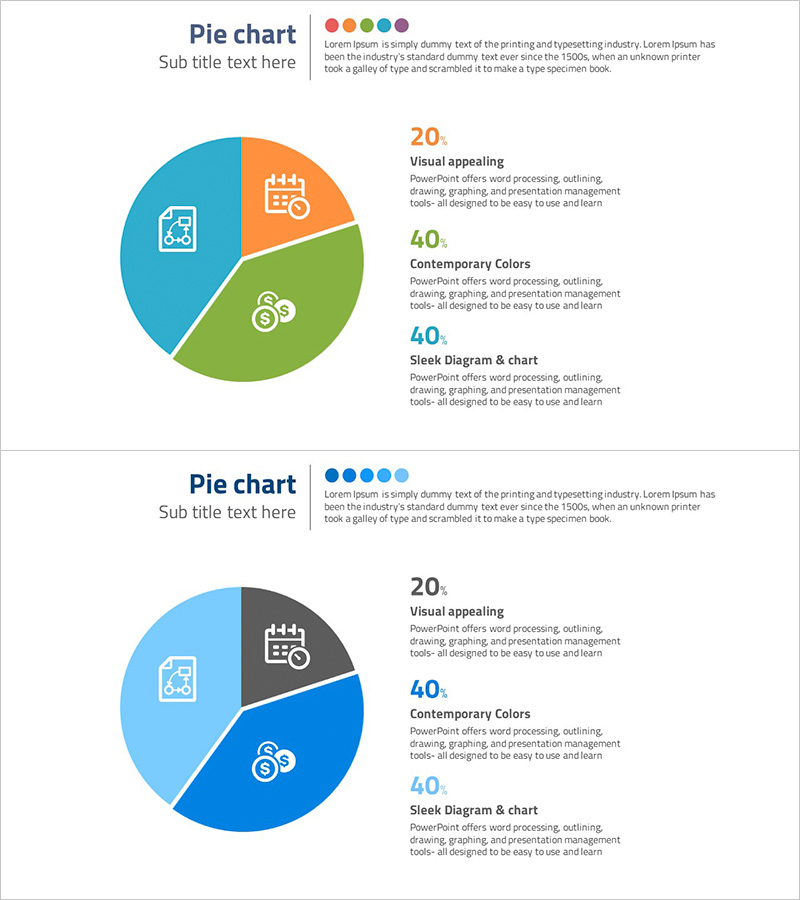
Budget Allocation by Strategic Focus
RJ0300044_25
- Last Update 12/21/2025
- File Size 0.2MB
- # of Slides 2
- File Format PPTX
- Slide Ratio 16:9
- Color
Keywords
About the Product
This slide features a pie chart illustrating the allocation ratio of resources by investment category. It visually represents the proportions of each item, making it suitable for analyzing efficient resource distribution and strategic discussions. The harmonious combination of vibrant red, orange, and blue enhances the visual appeal of the presentation. This slide is a valuable asset for business introductions and market surveys, effectively communicating clear information to decision-makers and investors. The editing difficulty is rated as 'easy', allowing for easy replacement of text and graphics for various purposes.
Related Products
-
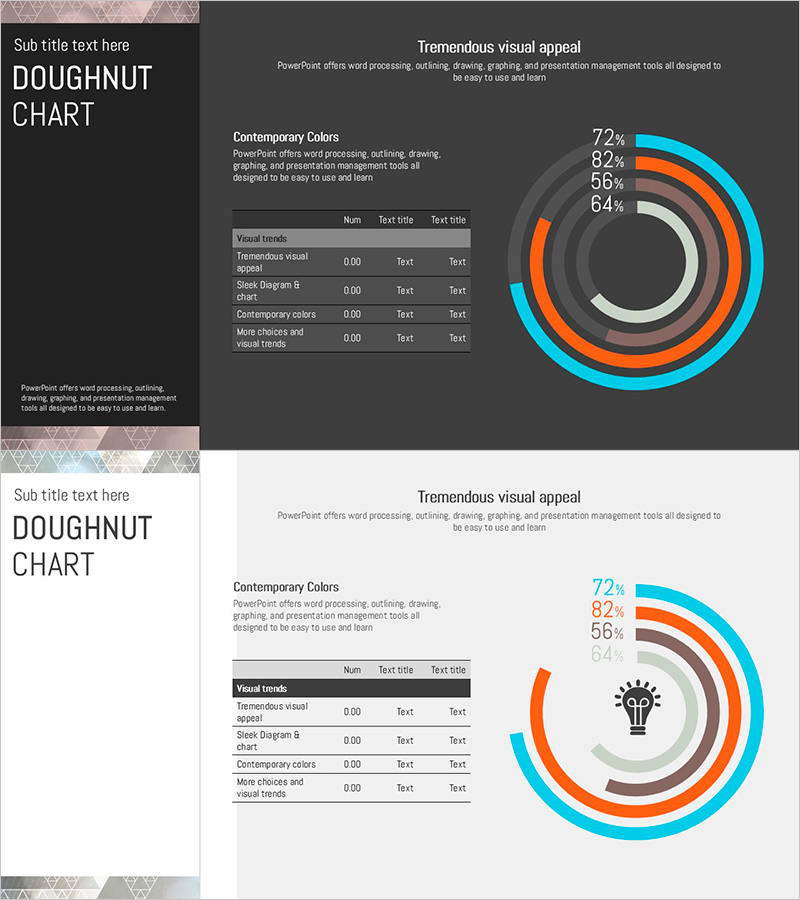
Doughnut Chart for Financial Performance Visualization – Current Technology Status
#Business Introduction #Financial Plans and Performance #Diagram
-

Data Analysis with Zombie Hand Graph Visualization
#Market and Competitor Analysis #Graph #Competitor Analysis
-
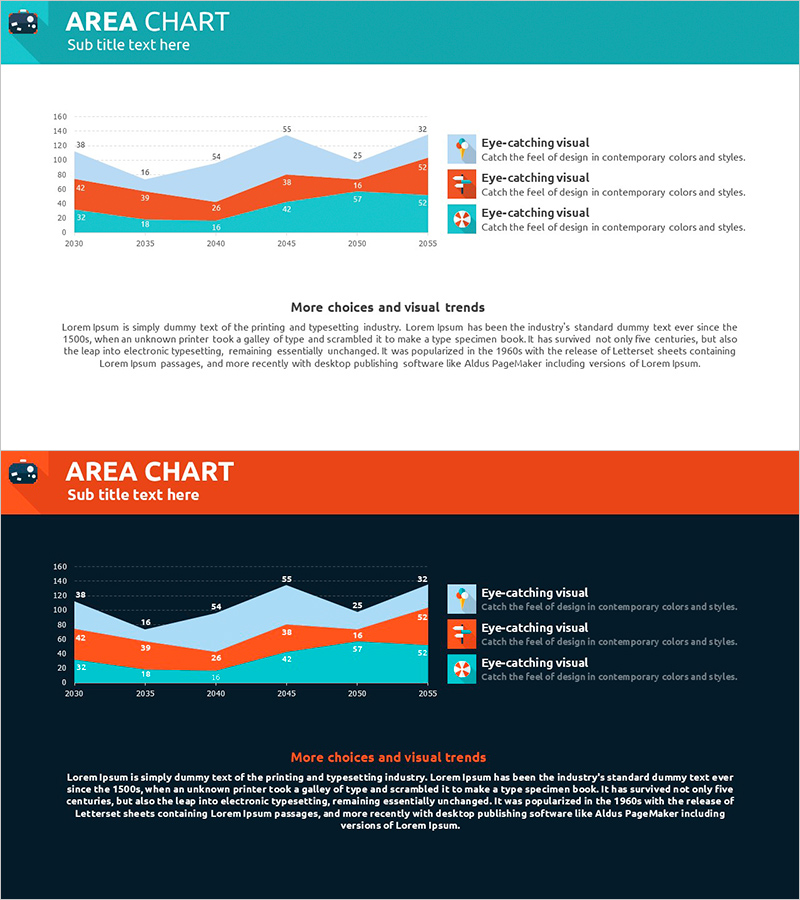
World Travel Template Area Chart
#Market and Competitor Analysis #Graph #Other
-
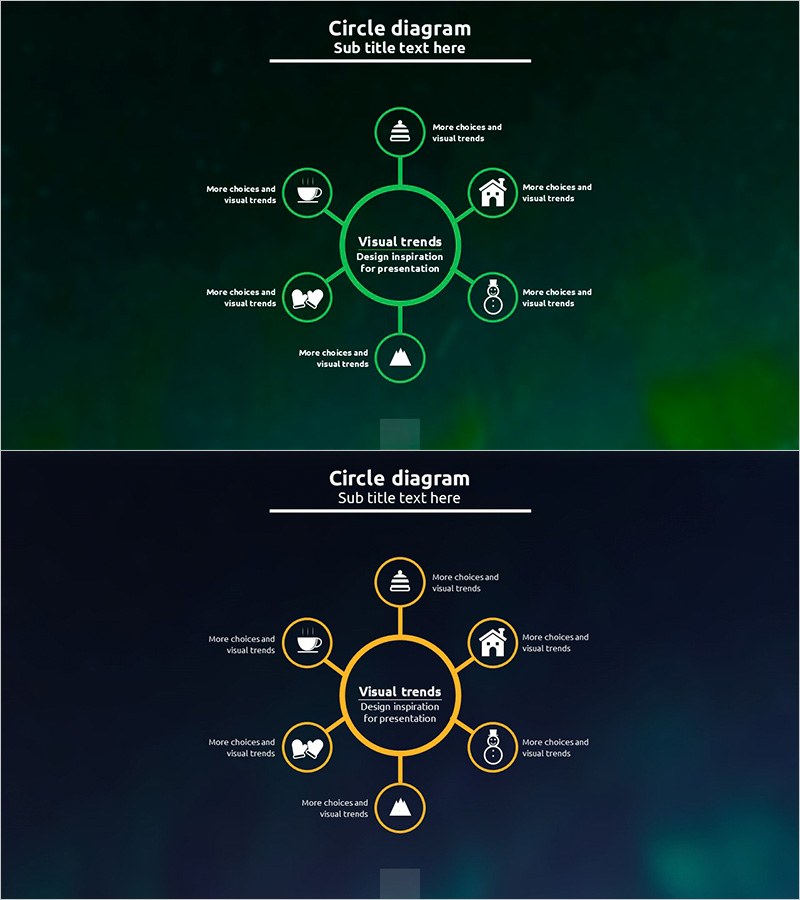
Configuration Diffusion Diagram – Business Area and Technology Sector
#Business Introduction #Technology Sector #Diagram
