Business Introduction
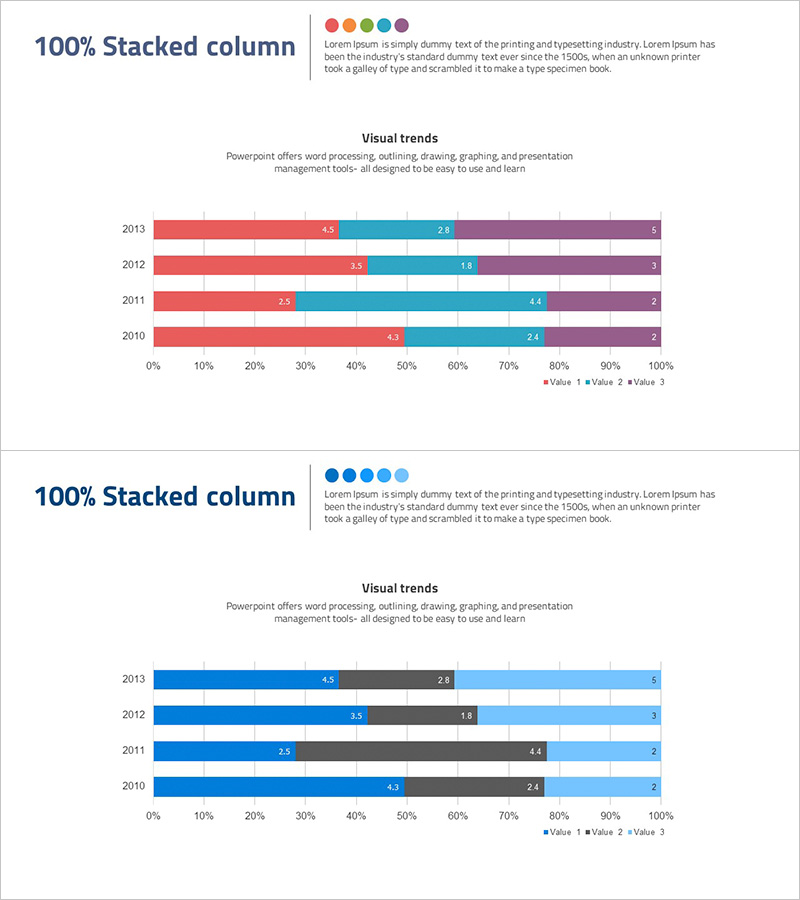
Content Composition Breakdown by Year with Horizontal Bar Chart
RJ0300044_17
- Last Update 12/21/2025
- File Size 0.2MB
- # of Slides 2
- File Format PPTX
- Slide Ratio 16:9
- Color
Keywords
About the Product
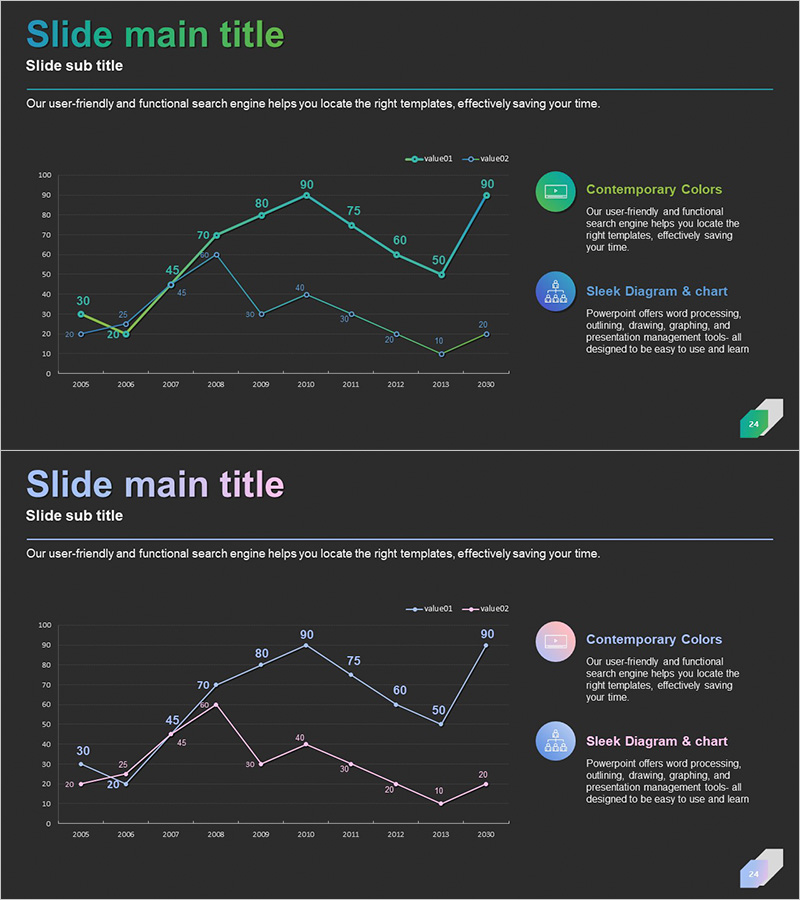
This slide presents a comparison of content composition by year using a horizontal bar chart. Its insightful visual structure makes it effective for various business analysis and market research reports. The harmonious blend of orange, red, and blue emphasizes the professionalism and reliability of the data being presented. This slide is ideal for educational, research, and business strategy meetings, with easy editing capabilities making the overall editing difficulty 'moderate'.
Related Products
-
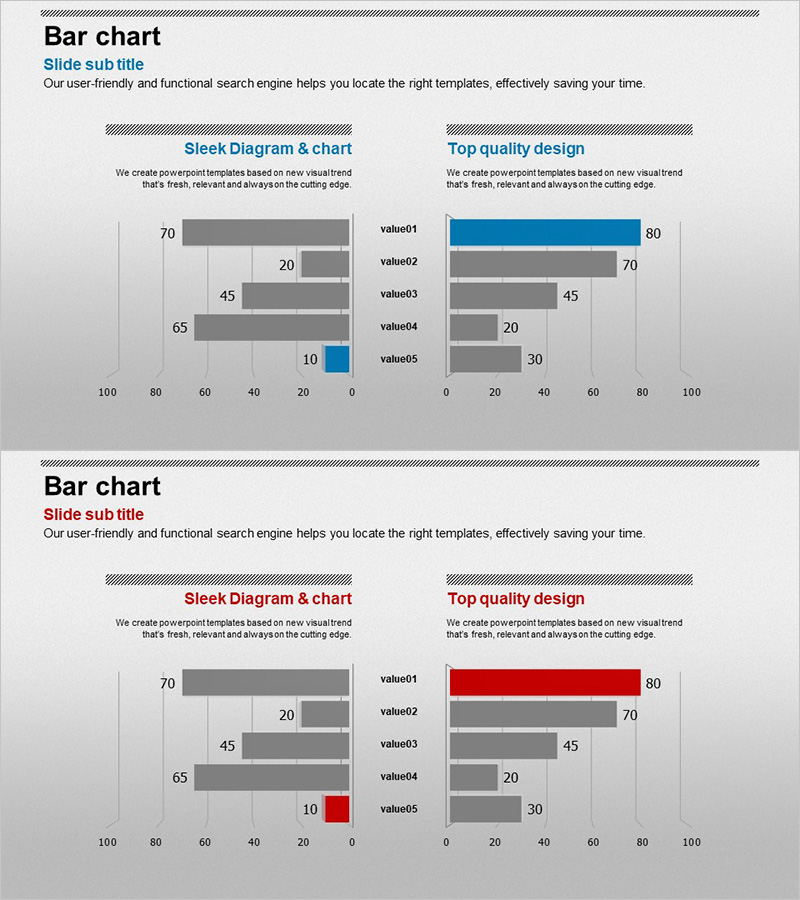
Competitor Analysis Double Bar Graph – Visualizing Competitive Advantage
#Market and Competitor Analysis #Graph #Competitor Analysis
-
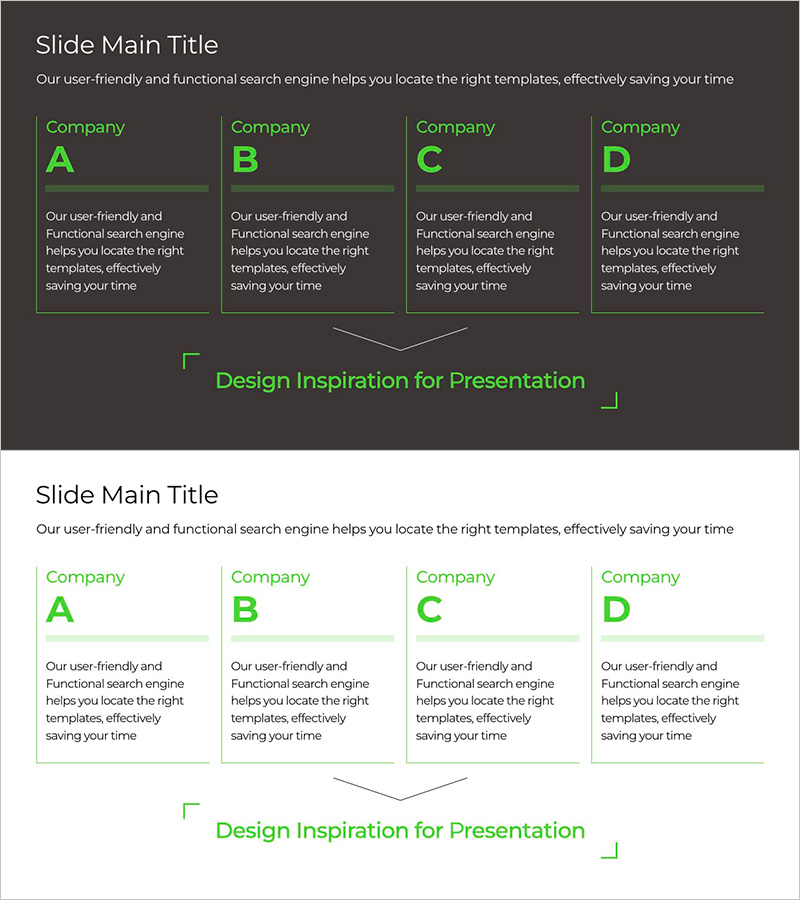
Green & Gray Wide Diagram Template for Product/Service Introduction
#Product/Service #Market and Competitor Analysis #Differentiation Strategy for Products/Services
-
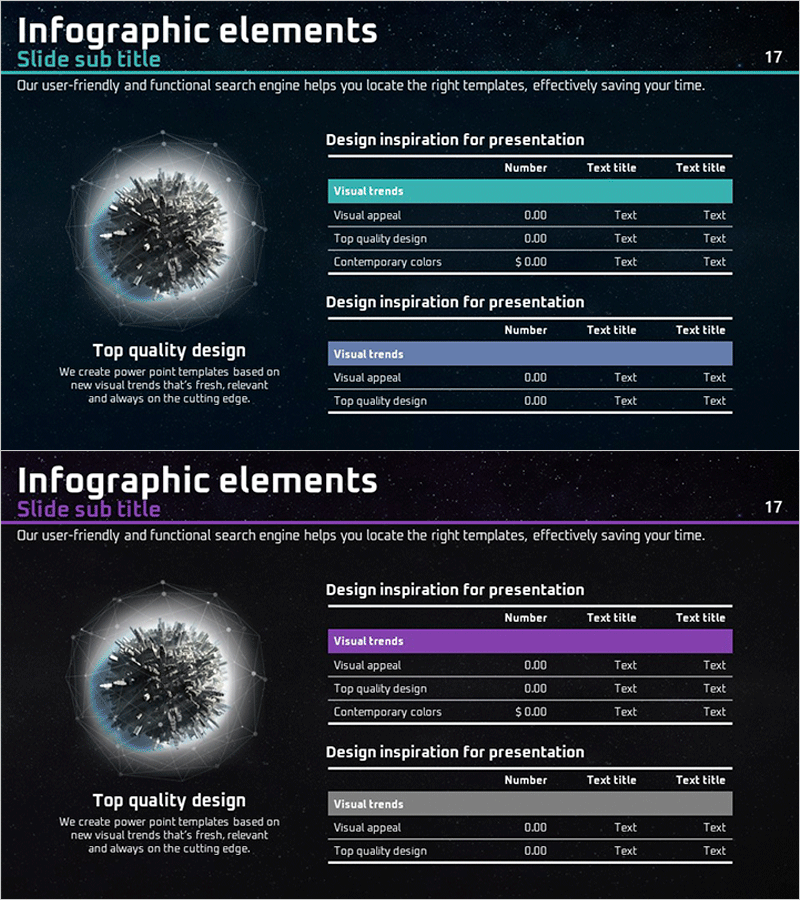
Space Analysis Table Chart – Market and Competitor Analysis
#Market and Competitor Analysis #Diagram #Market Analysis
-
Gradient Theme Broken Line Graph – Market Analysis and Competitive Edge
#Market and Competitor Analysis #Graph #Competitor Analysis
