Business Vision and Strategy
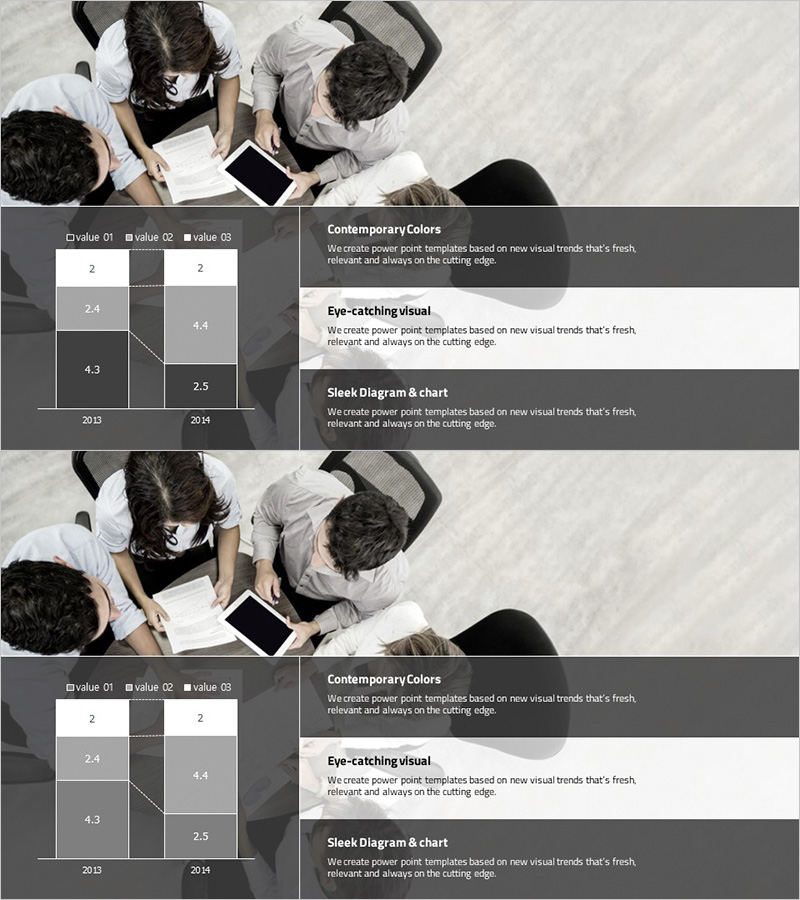
Business Meeting Analysis Graph – Visualization for Achieving Business Goals
RJ0300042_29
- Last Update 12/21/2025
- File Size 0.9MB
- # of Slides 2
- File Format PPTX
- Slide Ratio 16:9
- Color
Keywords
About the Product
This slide features horizontal and vertical bar graphs designed for effective data analysis and presentation in business meetings. The graphs compare critical values from 2013 and 2014, providing a clear visualization of data analysis. Featuring contemporary colors and sleek design, it effectively highlights key points, capturing the audience's attention and enhancing understanding. Ideal for emphasizing business goals, this template is useful for conveying crucial messages to investors. The text and data sections are easily replaceable, with an editing difficulty rated as 'easy', making it quick to integrate into various business presentations.
Related Products
-
Aging Graph – Effective Visualization for Market and Competitor Analysis
#Business Vision and Strategy #Market and Competitor Analysis #Diagram
-
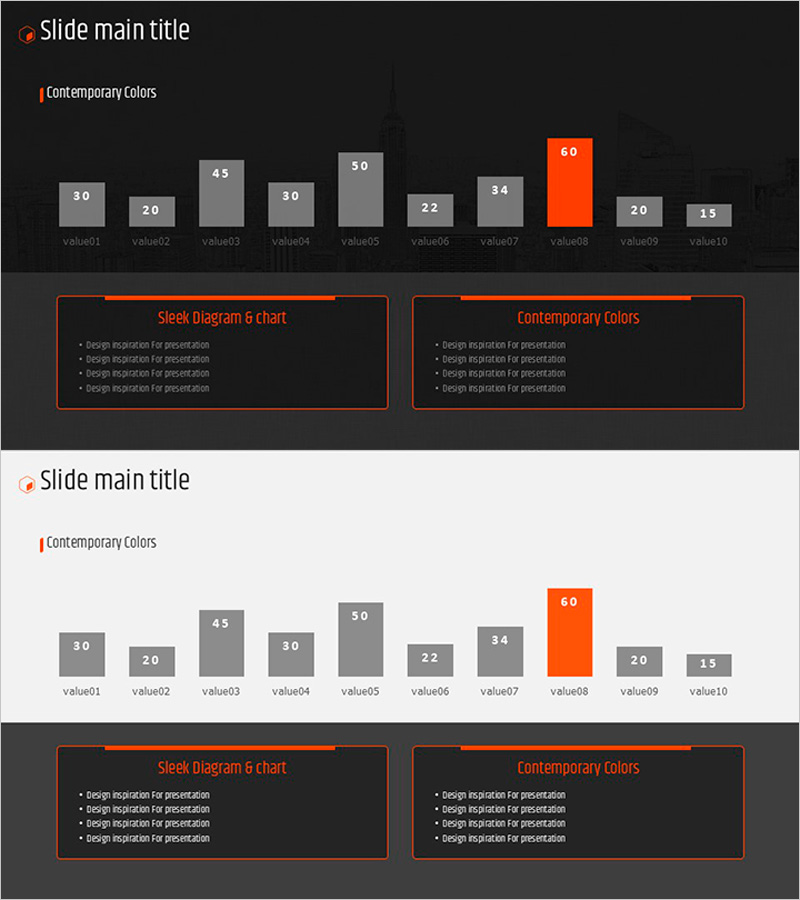
Orange Hexagon Presentation Template Vertical Bar Graph
#Market and Competitor Analysis #Financial Plans and Performance #Graph
-
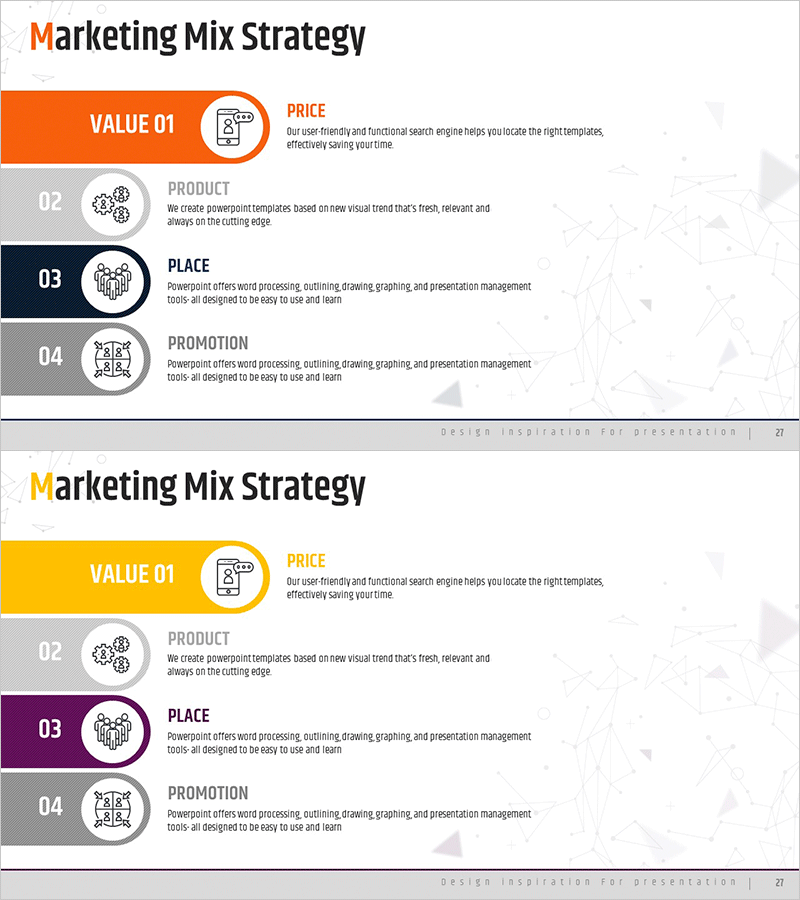
Marketing Mix 4P Diagram – Business Strategy Development
#Business Vision and Strategy #Marketing Plan and Strategy #Diagram
-
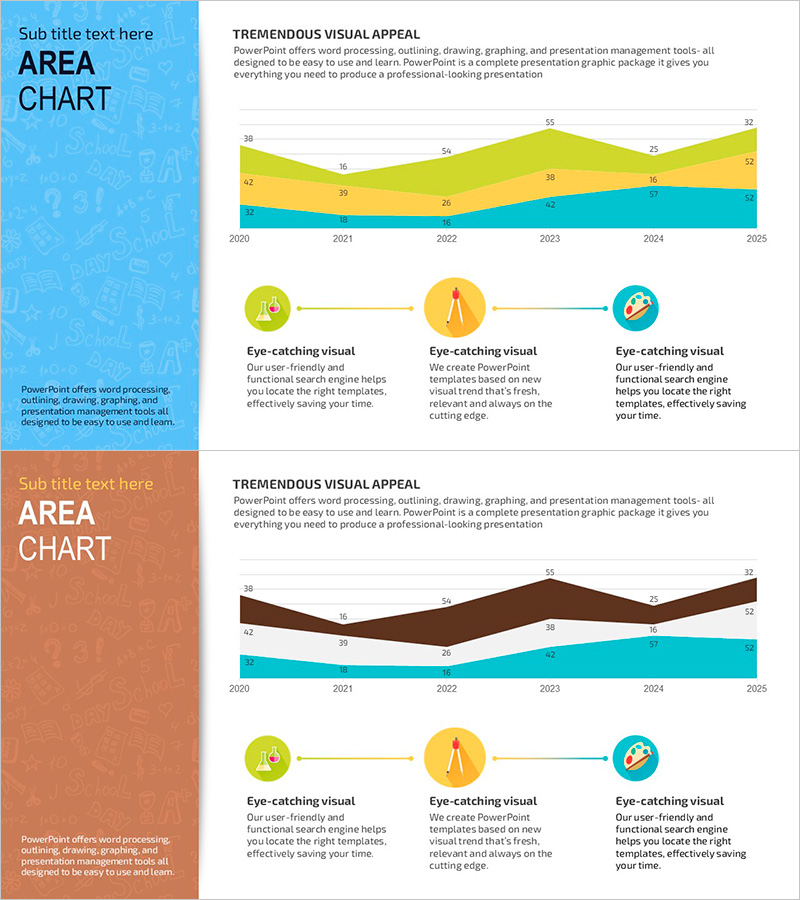
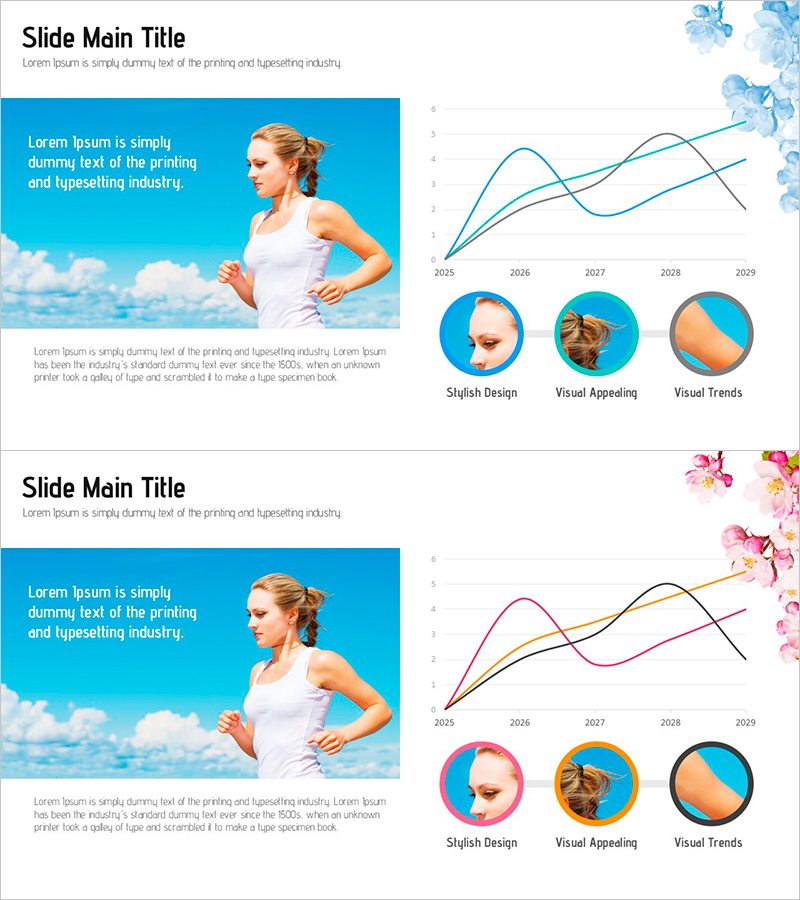
Area Charts and Learning Tool Icons – Essential Slide for Market Analysis
#Market and Competitor Analysis #Graph #Other
