Business Introduction
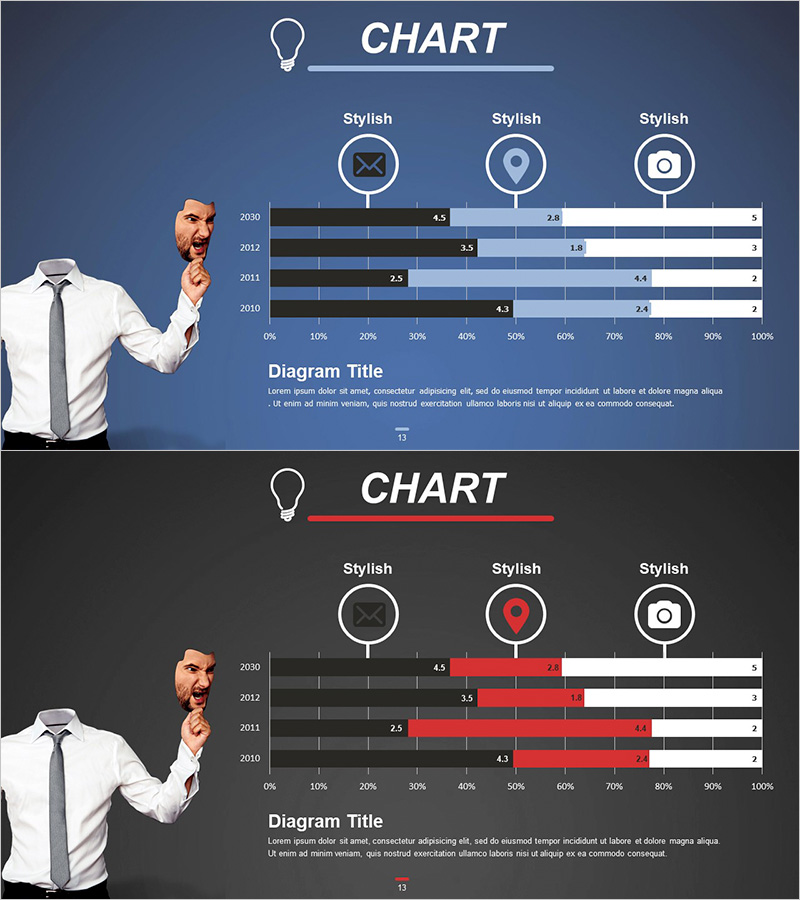
Business Sector Analysis Chart – Multifaceted Visualization
RJ0300040_16
- Last Update 12/21/2025
- File Size 1.5MB
- # of Slides 2
- File Format PPTX
- Slide Ratio 16:9
- Color
Keywords
- #Content-Based Slides
- #Design-Based Slides
- #Business Introduction
- #Market and Competitor Analysis
- #Diagram
- #Graph
- #Technological Status
- #Market Analysis
- #Cluster
- #Horizontal Bar
- #Chain Diagram
- #Segmented Horizontal Bar
- #16:9
- #Business Sector
- #Market Analysis
- #Business Introduction
- #Competitor Analysis
- #Diagram
About the Product
This slide utilizes horizontal bar charts to intuitively visualize data for business sector analysis. The modern design and the blue, red, and black color palette enhance information delivery efficiency, making it suitable for various industry business analyses. Key information and statistics are presented in a clustered format for easy comprehension, while the slide distinctly separates the title area and data section for the presenter to highlight essential points. It is instantly applicable for professionals, executives, and market analysts across different fields.
Related Products
-
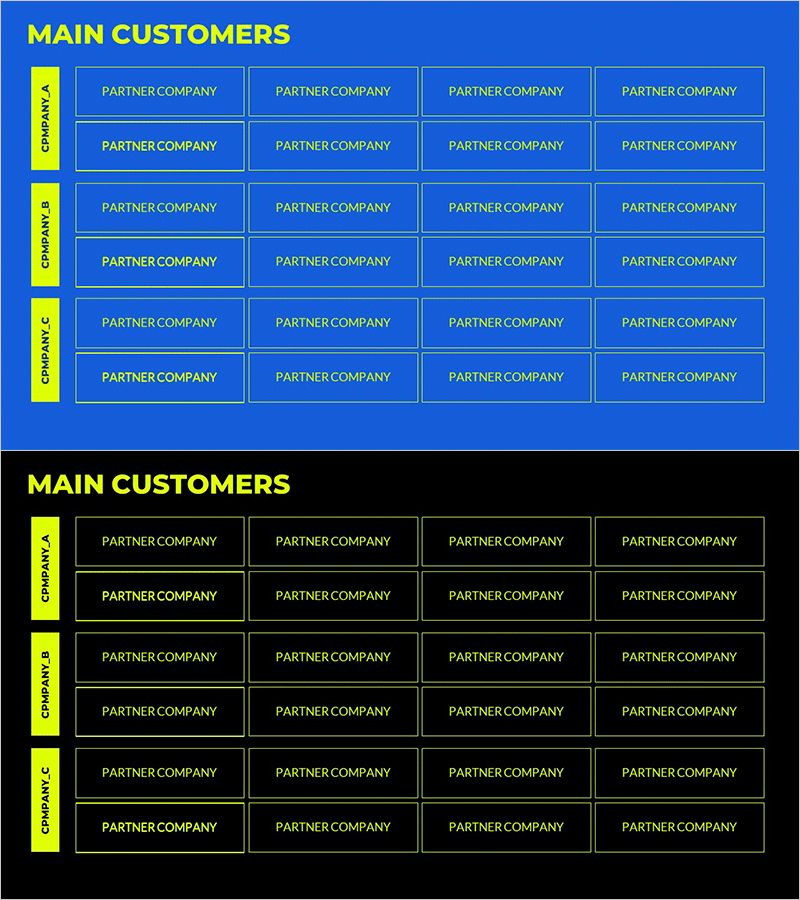
List of Major Customer Companies by Part – Customer Success Stories
#Company Introduction #Customer Success Stories #Diagram
-

US Target Area Slide – Market Analysis and Strategy
#Market and Competitor Analysis #Marketing Plan and Strategy #Other
-
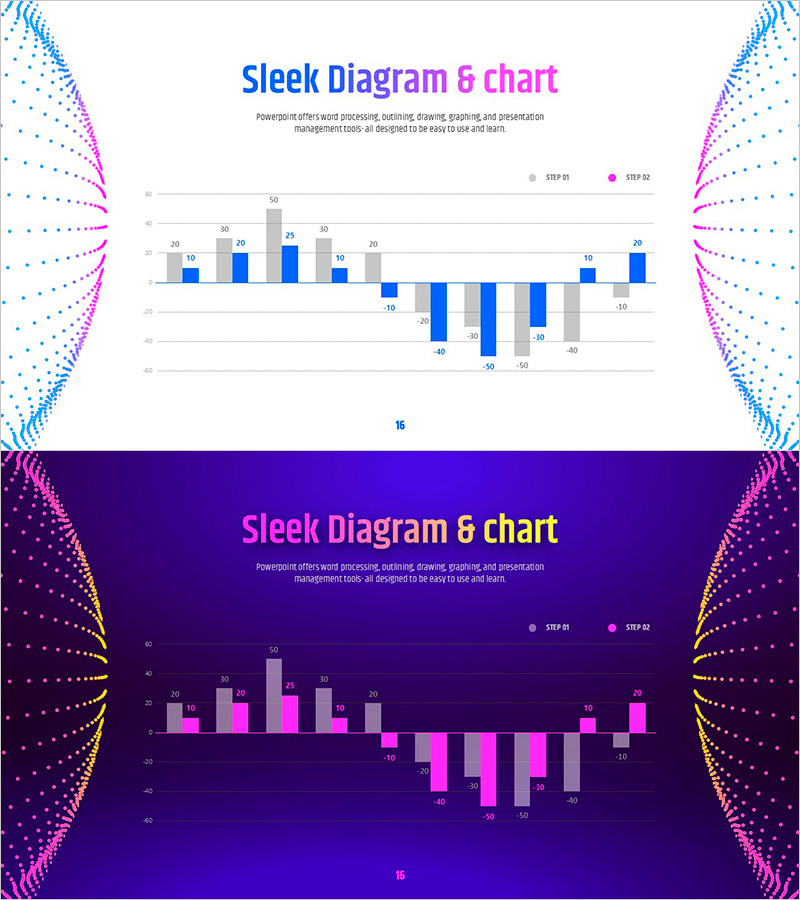
Analyze Sales Performance with Geometric Pattern Wide Bar Chart
#Market and Competitor Analysis #Financial Plans and Performance #Graph
-
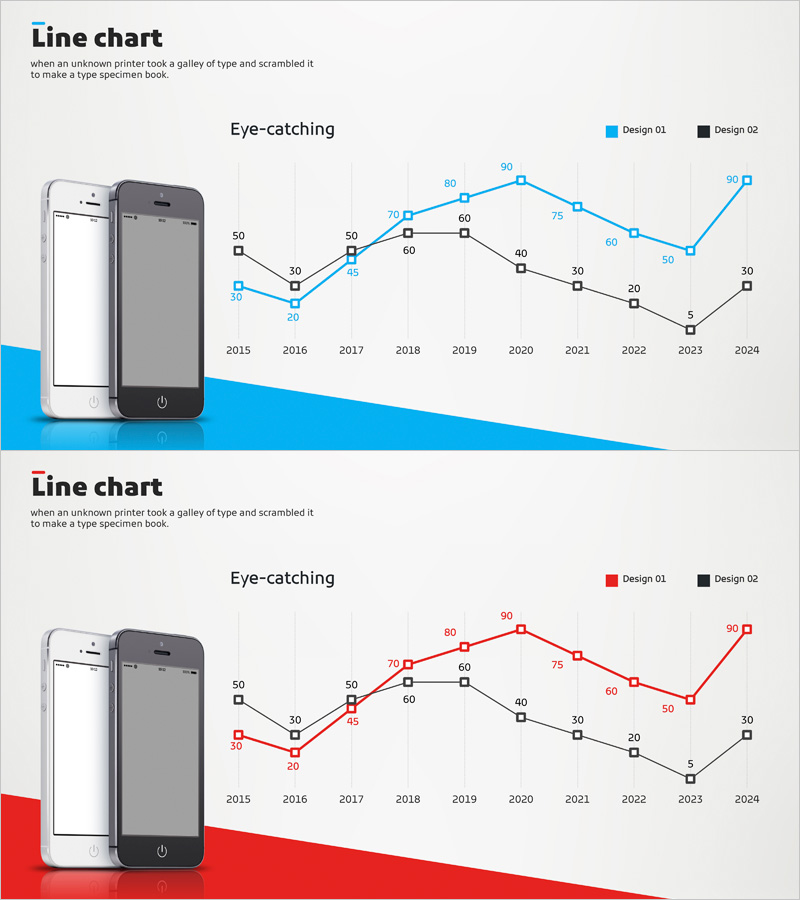
Mobile App Competitor Analysis – Visualizing Market Share
#Market and Competitor Analysis #Graph #Other
