Market and Competitor Analysis
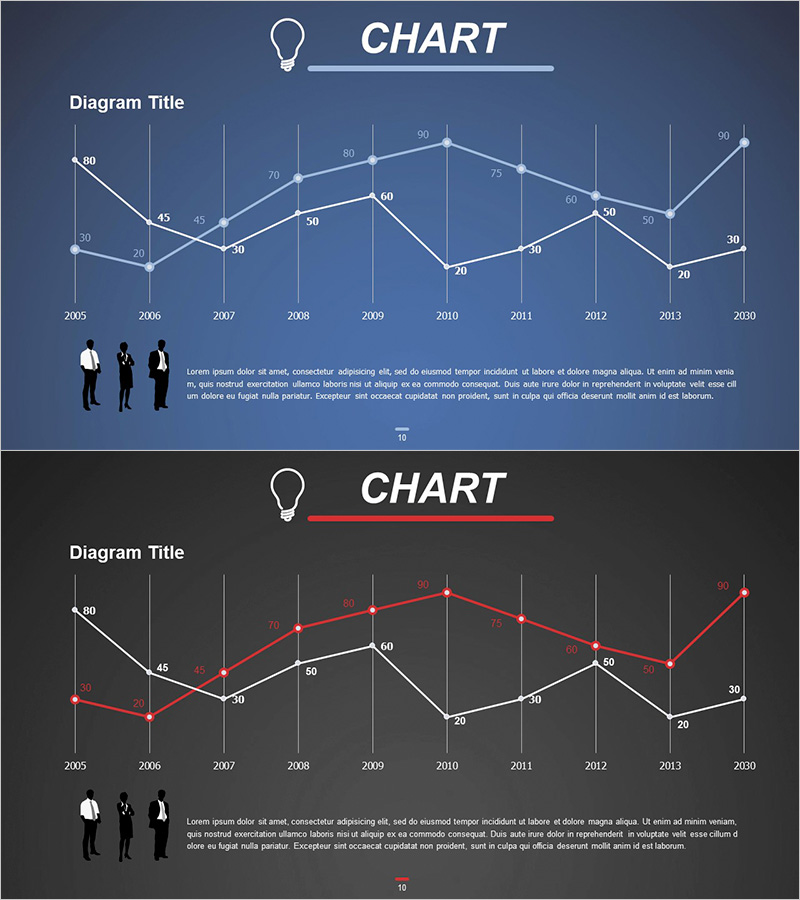
Competitor Analysis Broken Line Graph – Visualizing Market Trends
RJ0300040_13
- Last Update 12/21/2025
- File Size 1MB
- # of Slides 2
- File Format PPTX
- Slide Ratio 16:9
- Color
Keywords
About the Product
This slide features a broken line graph designed to effectively visualize market trends among competitors. With a color palette of blue, red, and black, it clearly distinguishes data comparisons and visually presents information across various years. This slide is ideal for business meetings, investment proposals, or research reports focusing on market and competitor analysis. Text and data replacement is easy, with an editing difficulty rated as 'easy', making it adaptable for various presentations.
Related Products
-
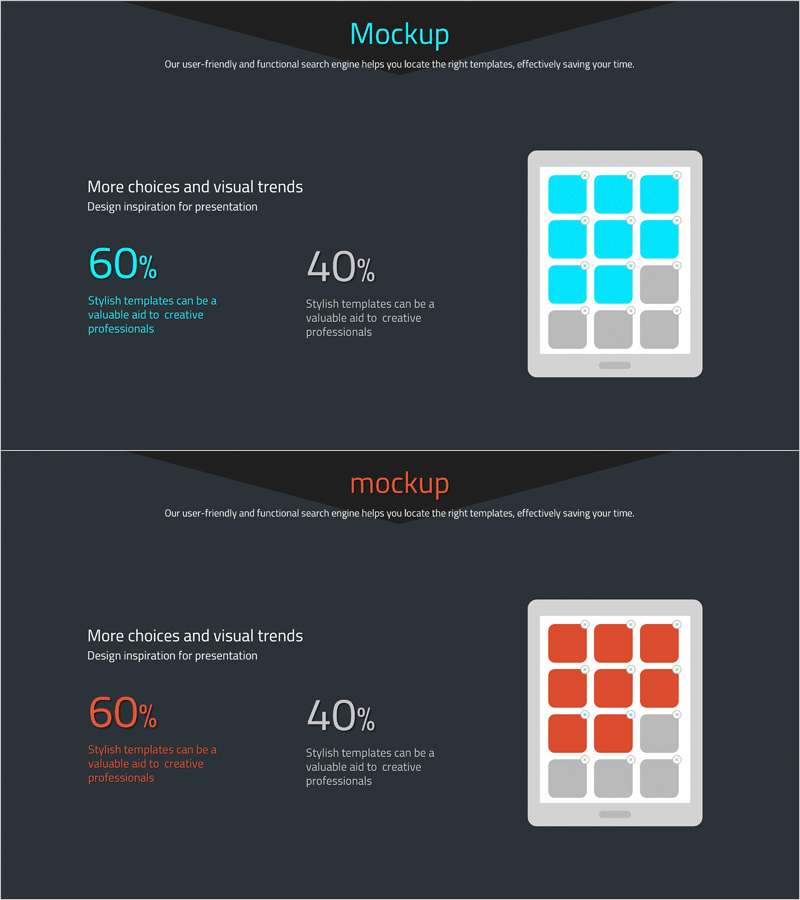
Visualizing Product Introduction with App Icon Graph – Innovation and Trends
#Product/Service #Business Introduction #Graph
-
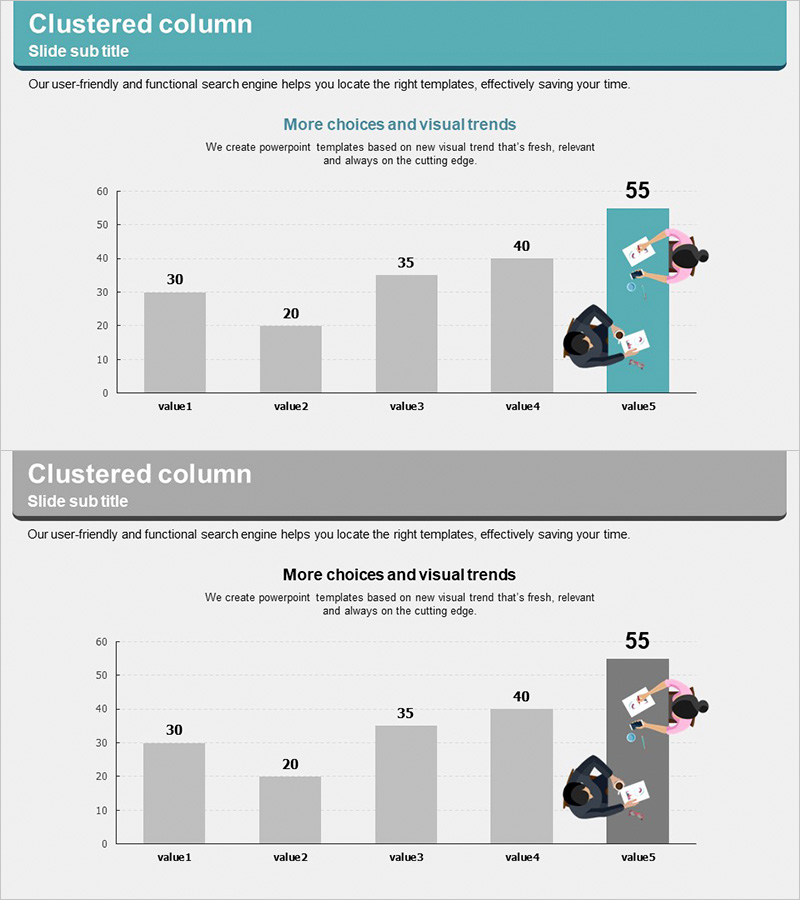
Business Meeting Analysis Bar Graph Slide – Market and Competitive Analysis
#Market and Competitor Analysis #Graph #Future Outlook
-
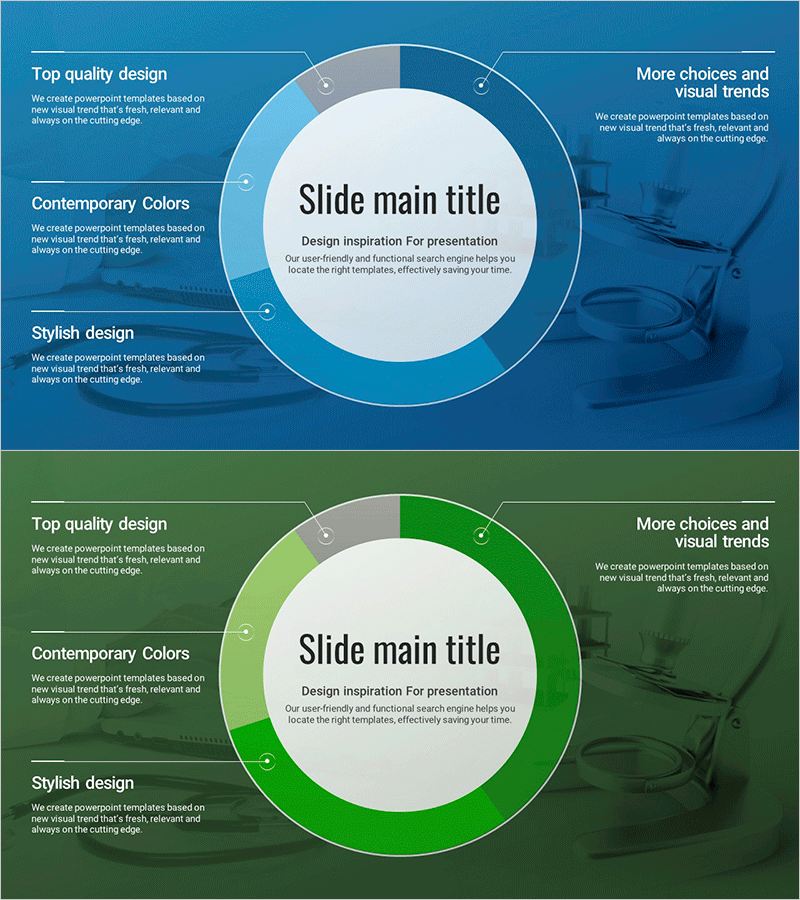
Data Analysis Donut Circle Graph – The Start of Effective Visualization
#Product/Service #Technology Sector #Diagram
-

Segmentation Horizontal Graphs in Architecture – Market Trend Analysis
#Market and Competitor Analysis #Graph #Industry Trends
